Open Access
Figure 6
Download original image
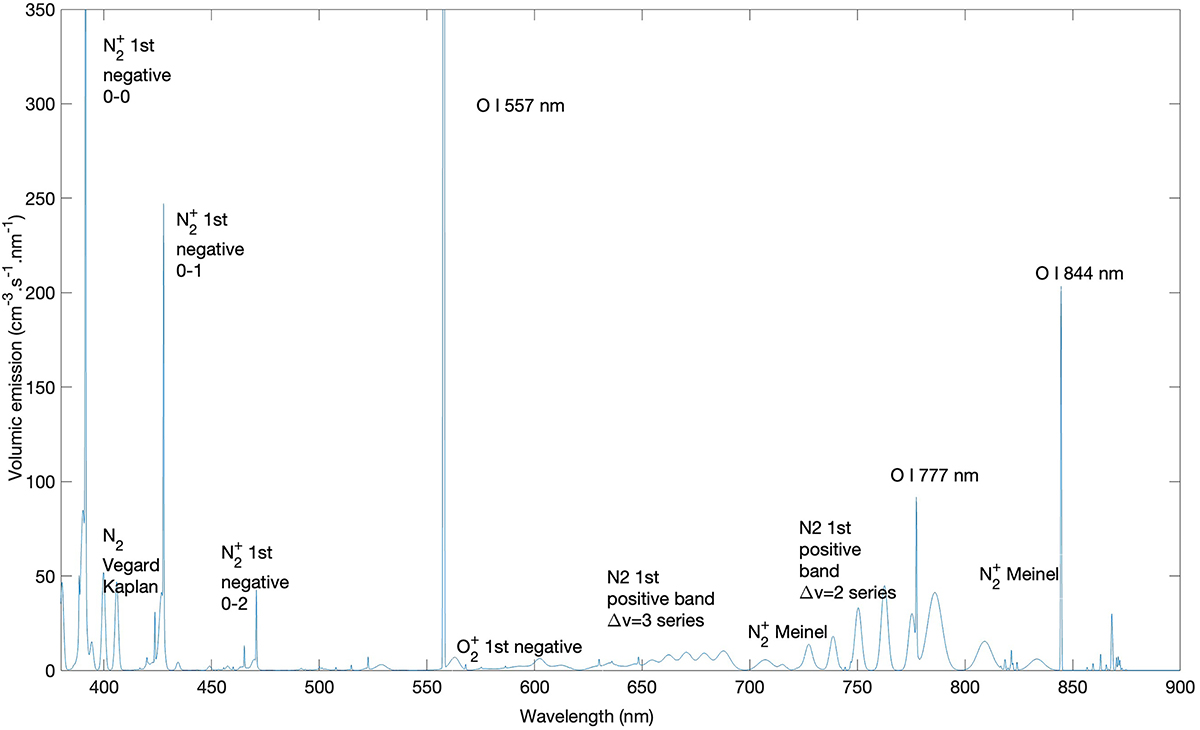
Spectrum at 114 km with the same parameters as in Figure 5. The green line peaks at 3432 cm−3 · s−1 · nm−1 and the ![]() line at 391.3 nm peaks at 605 cm−3 · s−1 · nm−1. To help the reader to identify the emission lines and bands, the main ones are annotated.
line at 391.3 nm peaks at 605 cm−3 · s−1 · nm−1. To help the reader to identify the emission lines and bands, the main ones are annotated.
Current usage metrics show cumulative count of Article Views (full-text article views including HTML views, PDF and ePub downloads, according to the available data) and Abstracts Views on Vision4Press platform.
Data correspond to usage on the plateform after 2015. The current usage metrics is available 48-96 hours after online publication and is updated daily on week days.
Initial download of the metrics may take a while.