Figure 8
Download original image
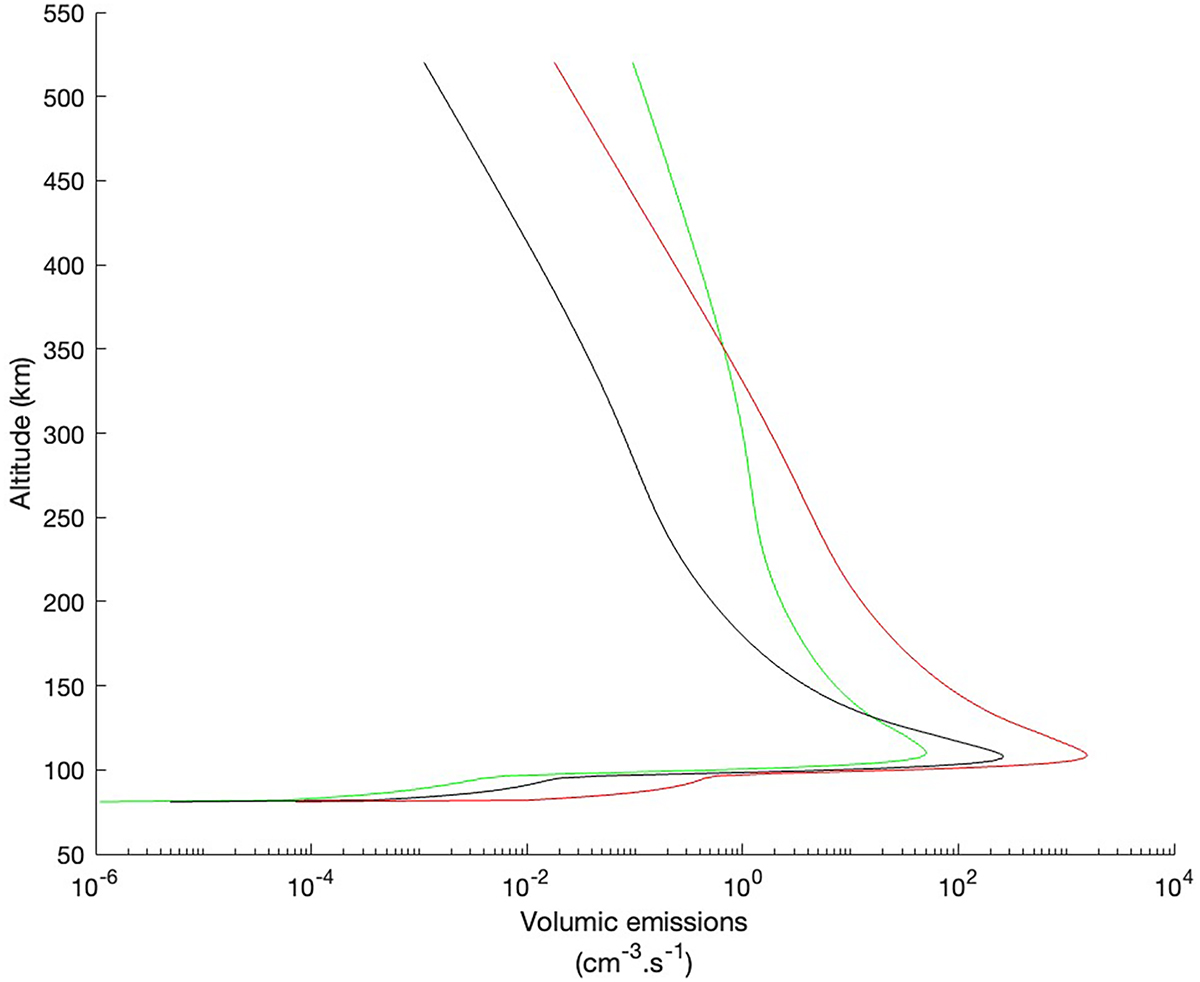
Altitude profiles of three emission lines directly linked with the electron precipitation: ![]() 427 nm line (black curve), the O I 844 nm line (green curve) and the full first positive band of N2 (red curve). The same parameters as in Figure 5 are used. Note that the first positive band is spread over a wide wavelength range as shown in Supplementary material.
427 nm line (black curve), the O I 844 nm line (green curve) and the full first positive band of N2 (red curve). The same parameters as in Figure 5 are used. Note that the first positive band is spread over a wide wavelength range as shown in Supplementary material.
Current usage metrics show cumulative count of Article Views (full-text article views including HTML views, PDF and ePub downloads, according to the available data) and Abstracts Views on Vision4Press platform.
Data correspond to usage on the plateform after 2015. The current usage metrics is available 48-96 hours after online publication and is updated daily on week days.
Initial download of the metrics may take a while.