Figure 4
Download original image
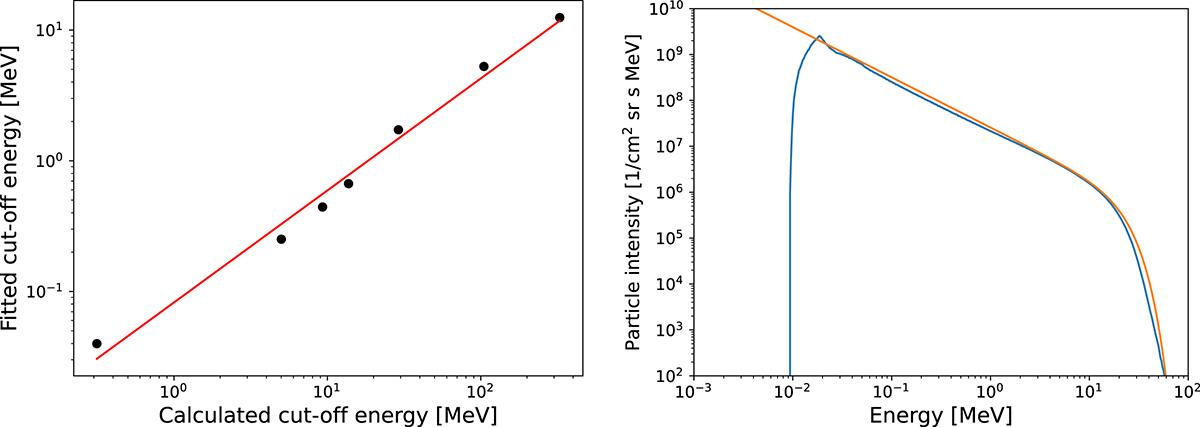
Left panel: Cutoff energy obtained in Runs 1–7 versus the cutoff energy calculated based on equation (27). The red line is a power-law fit given by equation (26). Right panel: Example of the simulated particle spectrum at the shock (blue line) and the reproduced spectrum based on the analytical model (orange line). The case presented is run 14.
Current usage metrics show cumulative count of Article Views (full-text article views including HTML views, PDF and ePub downloads, according to the available data) and Abstracts Views on Vision4Press platform.
Data correspond to usage on the plateform after 2015. The current usage metrics is available 48-96 hours after online publication and is updated daily on week days.
Initial download of the metrics may take a while.