Figure 13
Download original image
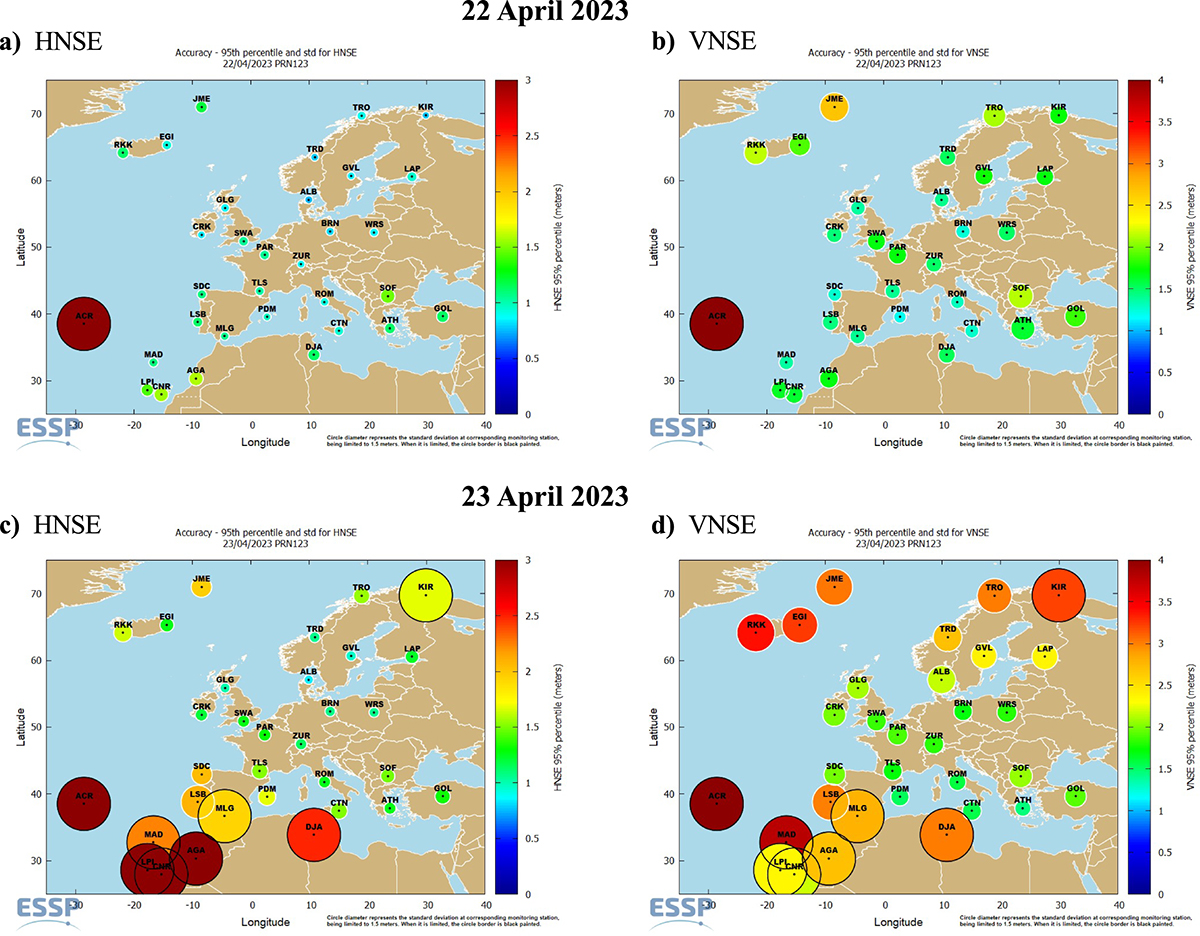
EGNOS performance summary plot with daily Horizontal and Vertical Navigation System Errors (HNSE and VNSE, respectively) for each station on (top) 22 April (pre-storm day) and (bottom) 23 April 2023 (storm day). Circle diameter indicates the standard deviation at corresponding monitoring station, being limited to 1.5 m; when it is limited, the circle border is black.
Current usage metrics show cumulative count of Article Views (full-text article views including HTML views, PDF and ePub downloads, according to the available data) and Abstracts Views on Vision4Press platform.
Data correspond to usage on the plateform after 2015. The current usage metrics is available 48-96 hours after online publication and is updated daily on week days.
Initial download of the metrics may take a while.