Figure 12
Download original image
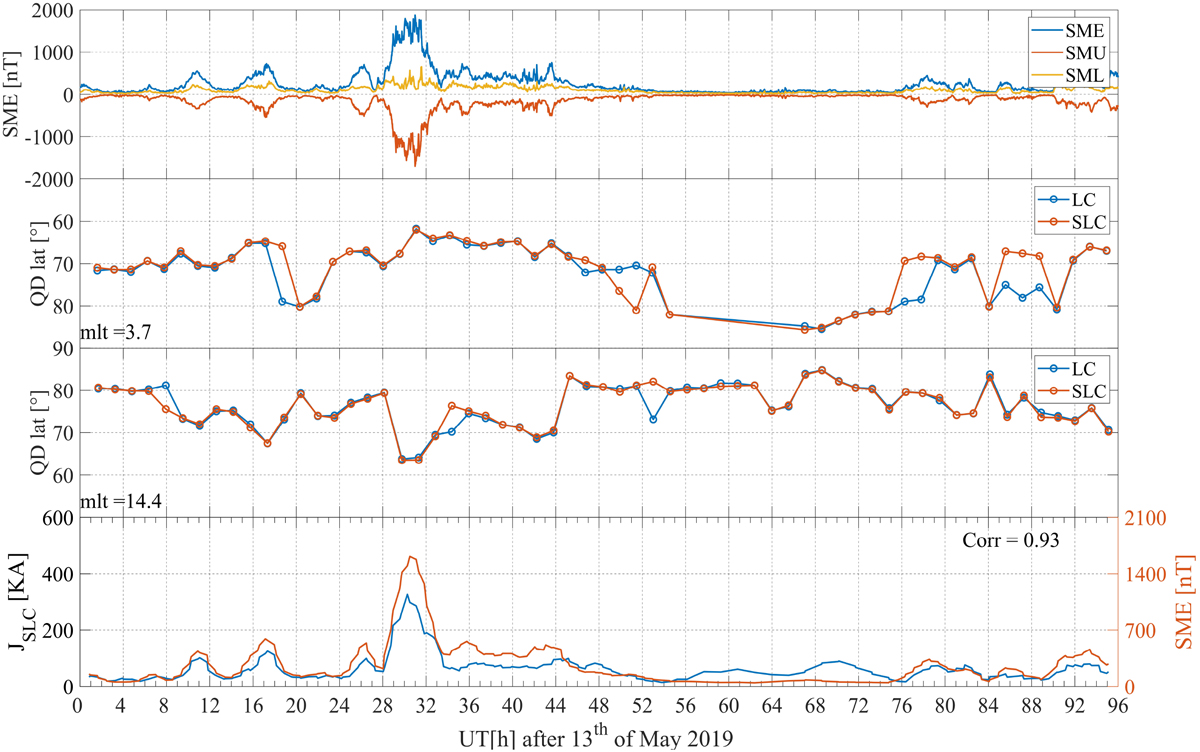
Using Swarm A data, the figure illustrates the estimated peak of AEJ positions using the SLC and LC methods for the Northern Hemisphere over four days starting from 13 March 2019. The second and third rows show the peak of AEJ positions for ascending and descending orbits, respectively. The first row represents the time variations of SME, SMU, and SML. The fourth row displays the time series of AEJ calculated using the SLC method compared to SME.
Current usage metrics show cumulative count of Article Views (full-text article views including HTML views, PDF and ePub downloads, according to the available data) and Abstracts Views on Vision4Press platform.
Data correspond to usage on the plateform after 2015. The current usage metrics is available 48-96 hours after online publication and is updated daily on week days.
Initial download of the metrics may take a while.