Figure 13
Download original image
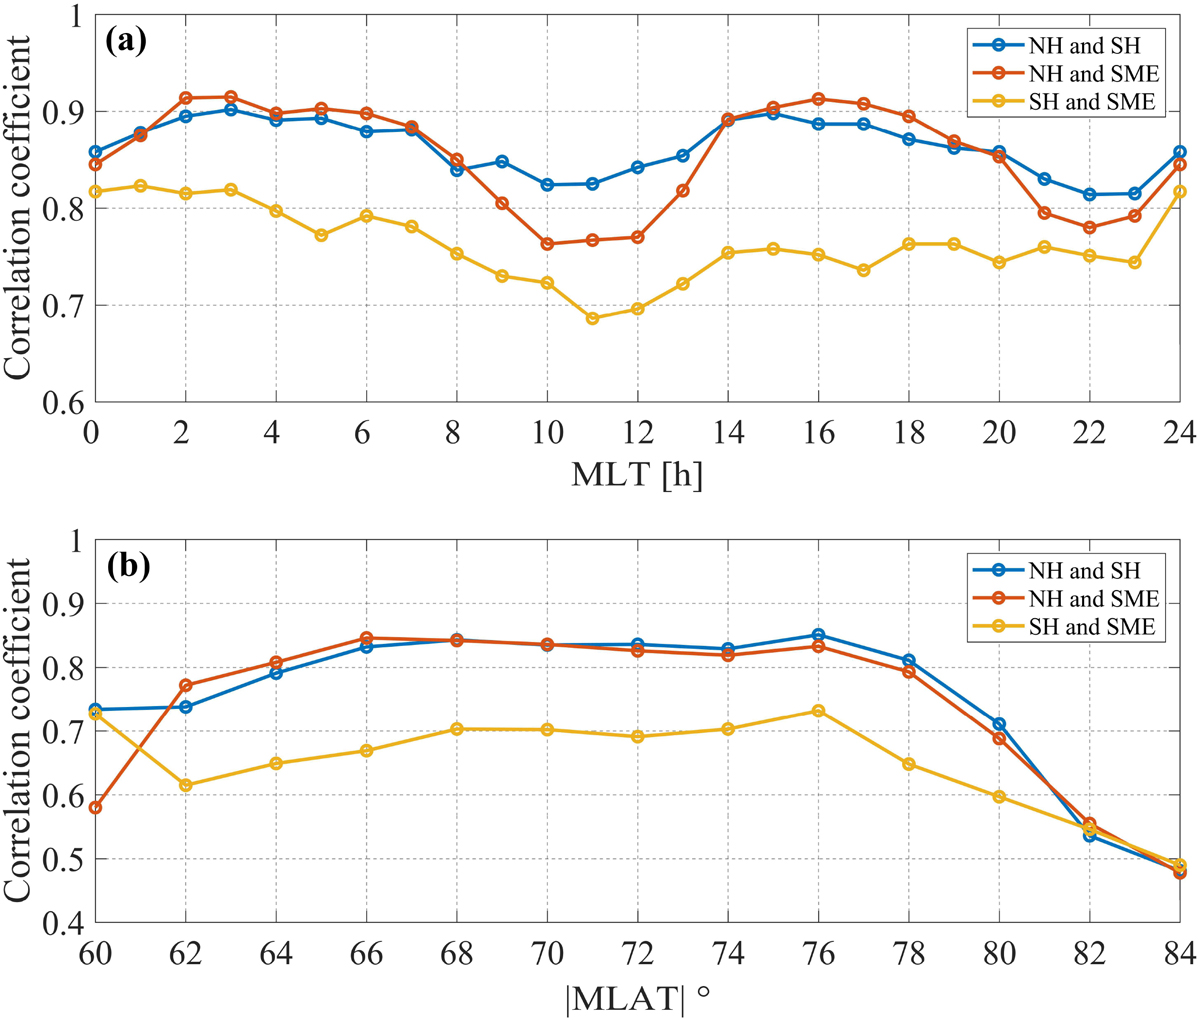
The correlation between the peak of AEJ calculated using the LC algorithm and the SME index, as well as the correlation between the peak of AEJ calculated using the SLC algorithm and the SME index, across different MLT and MLAT values. (Using 2s bin window based on Swarm A, data from Swarm A spanning the period from December 2013 to November 2023 were analyzed. A total of 182,811 detections were recorded, with 95,462 in the Northern Hemisphere and 87,349 in the Southern Hemisphere).
Current usage metrics show cumulative count of Article Views (full-text article views including HTML views, PDF and ePub downloads, according to the available data) and Abstracts Views on Vision4Press platform.
Data correspond to usage on the plateform after 2015. The current usage metrics is available 48-96 hours after online publication and is updated daily on week days.
Initial download of the metrics may take a while.