Figure 4
Download original image
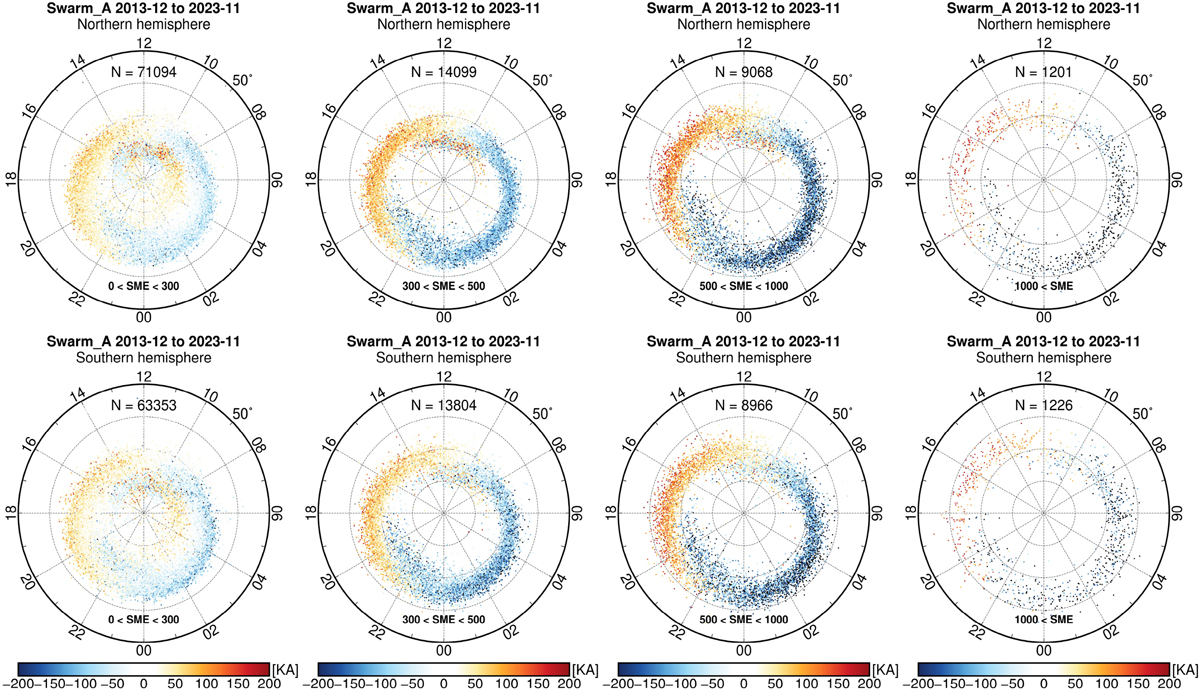
All detections collected from Swarm A data have been assigned based on the inferred current strength using the SLC method at QD coordinate system. The detections are shown for both the Northern and Southern Hemispheres, with 95,462 in the Northern Hemisphere and 87,349 in the Southern Hemisphere. An approximate 90-minute interval is allocated each hemisphere for collecting each peak dataset, while each detection phase takes about 20 min to analyze data points above 50° QD latitude. Negative values represent westward electrojets, while positive values represent eastward electrojets.
Current usage metrics show cumulative count of Article Views (full-text article views including HTML views, PDF and ePub downloads, according to the available data) and Abstracts Views on Vision4Press platform.
Data correspond to usage on the plateform after 2015. The current usage metrics is available 48-96 hours after online publication and is updated daily on week days.
Initial download of the metrics may take a while.