Figure 9
Download original image
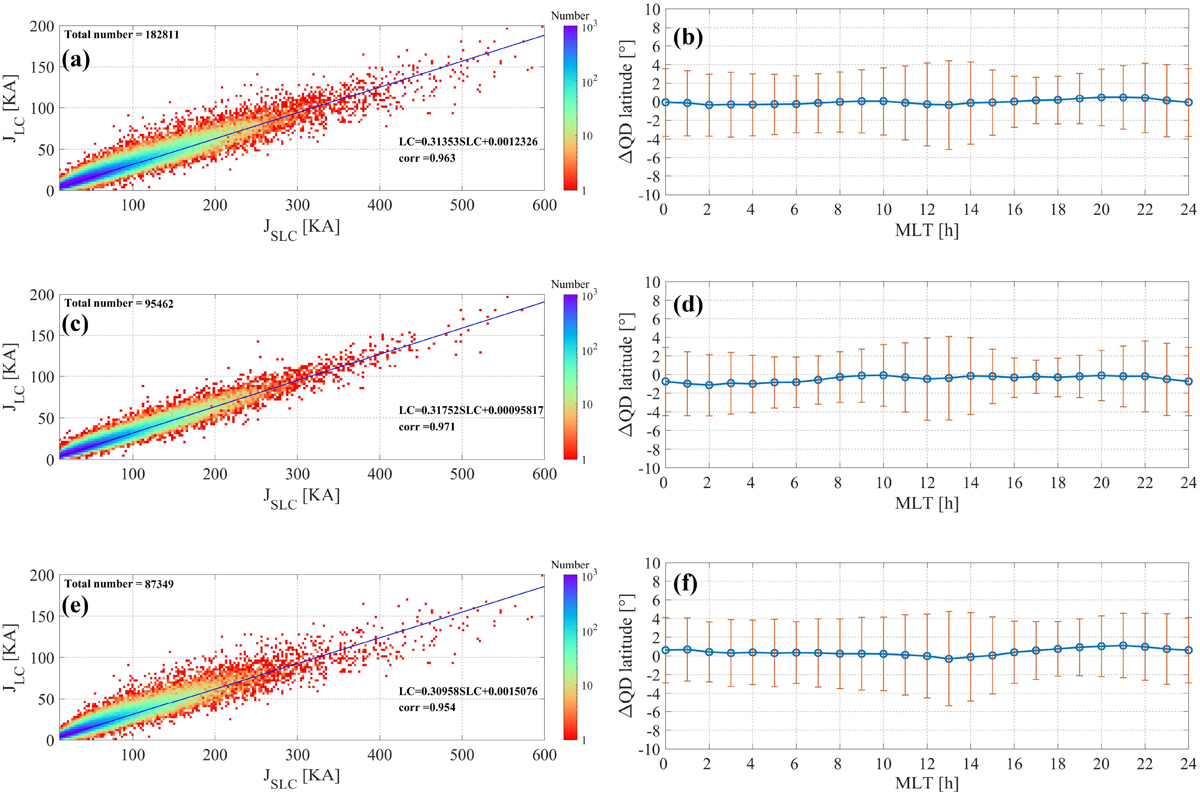
Swarm A based quantitative relationship study of the estimated intensities using the LC and SLC methods (a–b is the global result, c–d is the northern hemisphere result, e–f is the southern hemisphere result). The left panels present the peak current amplitude of the SLC method is shown on the bottom x-axis, and the peak current amplitude of the LC method is shown on the left y-axis. The color indicates the occurrence distribution of the collected data points. The line of fit is shown in solid blue. The right panels present the variation in estimated AEJ peak positions with local time for both the SLC and LC methods. ΔQD latitude represents the difference in estimated AEJ peak magnetic latitude between the SLC and LC methods in the QD coordinate system. The blue dots indicate the average relative error, while the red vertical lines represent the standard deviation, with an averaging window of 1 h.
Current usage metrics show cumulative count of Article Views (full-text article views including HTML views, PDF and ePub downloads, according to the available data) and Abstracts Views on Vision4Press platform.
Data correspond to usage on the plateform after 2015. The current usage metrics is available 48-96 hours after online publication and is updated daily on week days.
Initial download of the metrics may take a while.