Figure 4
Download original image
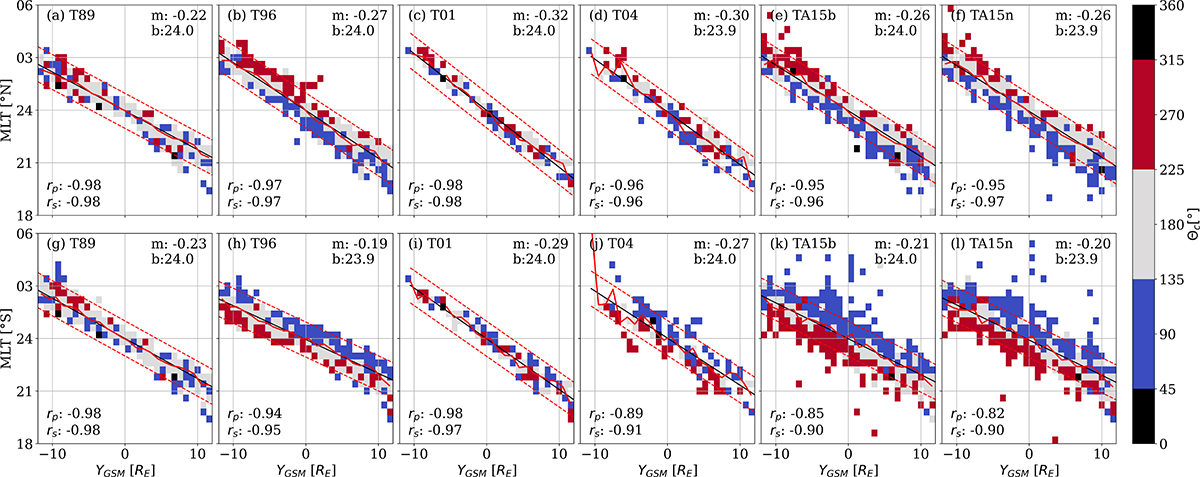
Relation between the BBF position (YGSM) and MLT for each Tsyganenko model. The solid black line is the linear regression, while the dashed red line is the linear regression shifted ±1 h. The solid red line indicates the mean value. Panels (a–d) correspond to the Northern Hemisphere, and panels (e–h) correspond to the Southern Hemisphere. The colorbar represents the IMF clock angle: Blue: IMF pointing towards dusk, Red: IMF pointing towards dawn, Gray: IMF pointing northward, and Black: IMF pointing southward.
Current usage metrics show cumulative count of Article Views (full-text article views including HTML views, PDF and ePub downloads, according to the available data) and Abstracts Views on Vision4Press platform.
Data correspond to usage on the plateform after 2015. The current usage metrics is available 48-96 hours after online publication and is updated daily on week days.
Initial download of the metrics may take a while.