Figure 5
Download original image
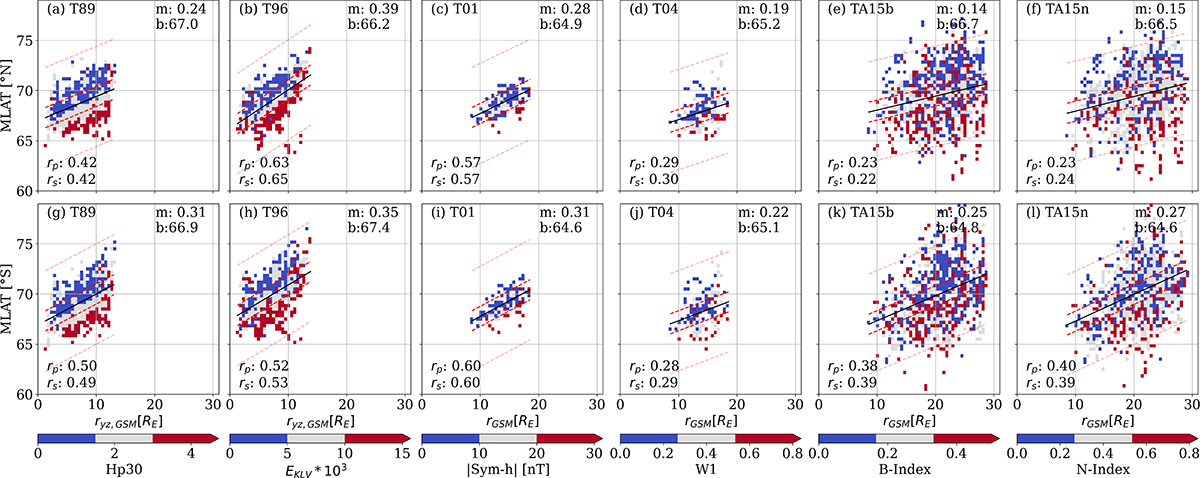
Relation between the BBF distance to Earth and MLAT for each Tsyganenko model. The color scale indicates the input variable or derived variable from the input parameters, with the largest correlation with MLAT. Panels (a–d) correspond to the Northern Hemisphere, and panels (e–h) correspond to the Southern Hemisphere. Each panel also displays the Pearson and Spearman correlation coefficients for MLAT versus distance represented by the x-axis. The solid black line is the linear regression, while the dashed red and pink lines are the linear regression shifted ±1° and ±5°, respectively.
Current usage metrics show cumulative count of Article Views (full-text article views including HTML views, PDF and ePub downloads, according to the available data) and Abstracts Views on Vision4Press platform.
Data correspond to usage on the plateform after 2015. The current usage metrics is available 48-96 hours after online publication and is updated daily on week days.
Initial download of the metrics may take a while.