Figure 7
Download original image
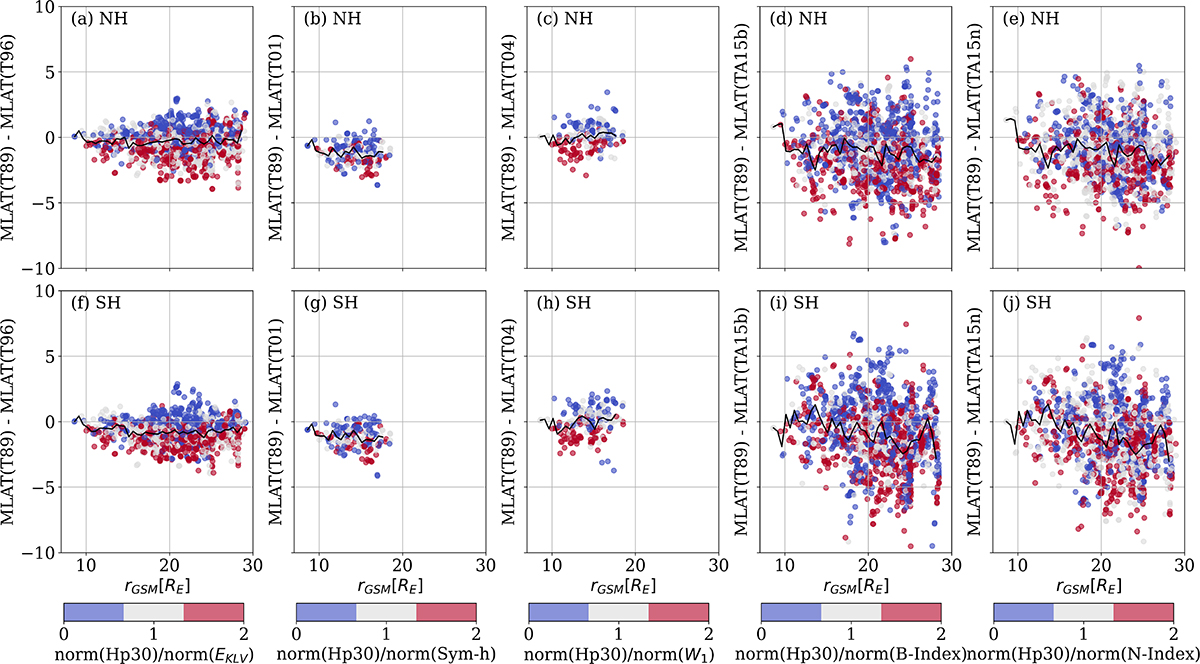
MLAT difference between T89 and (T96, T01, T04, TA15b, and TA15n) against the rGSM position of the BBF. The color scale represents the ratio of the normalized Hp30 geomagnetic index (input parameter in T89) to the normalized input parameters with the highest correlation (EKLV, Sym-h, W1, B-index, and N-index for T96, T01, T04, TA15b, and TA15n, respectively). The solid black line indicates the mean value. Normalization was performed using the median value.
Current usage metrics show cumulative count of Article Views (full-text article views including HTML views, PDF and ePub downloads, according to the available data) and Abstracts Views on Vision4Press platform.
Data correspond to usage on the plateform after 2015. The current usage metrics is available 48-96 hours after online publication and is updated daily on week days.
Initial download of the metrics may take a while.