Figure 8
Download original image
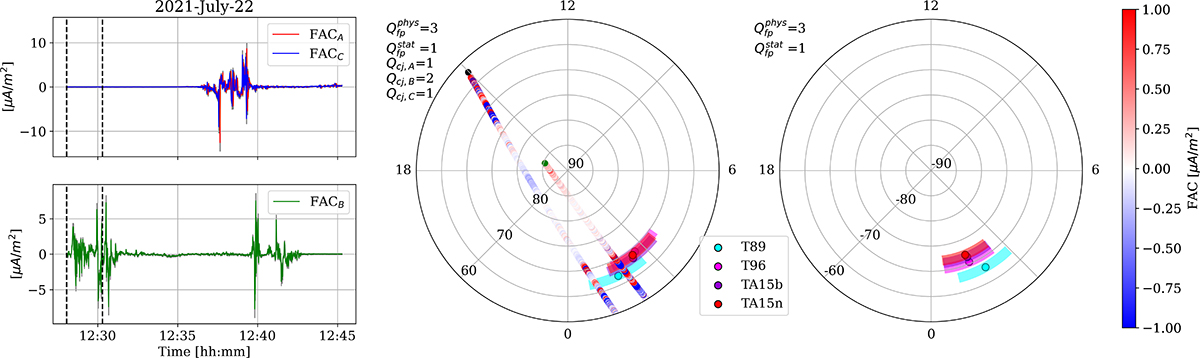
Example of BBF footpoint-Swarm conjunction for Swarm trace Δt = 15 min after end time of BBF detection. (Left) Swarm A, B, and C FAC measurements, and the BBF duration indicated with the two vertical dashed lines. (Right) Polar plot with Swarm traces across the Northern and Southern Hemispheres and the corresponding FAC intensity. The BBF footpoint for the different Tsyganenko models are represented by circles, with shaded areas indicating the errors ErrMLAT = ±1°, ErrMLT = ±1 h. The Qfp and Qcj indicate the footpoint quality and conjunction quality with Swarm A, B, and C.
Current usage metrics show cumulative count of Article Views (full-text article views including HTML views, PDF and ePub downloads, according to the available data) and Abstracts Views on Vision4Press platform.
Data correspond to usage on the plateform after 2015. The current usage metrics is available 48-96 hours after online publication and is updated daily on week days.
Initial download of the metrics may take a while.