Figure 10
Download original image
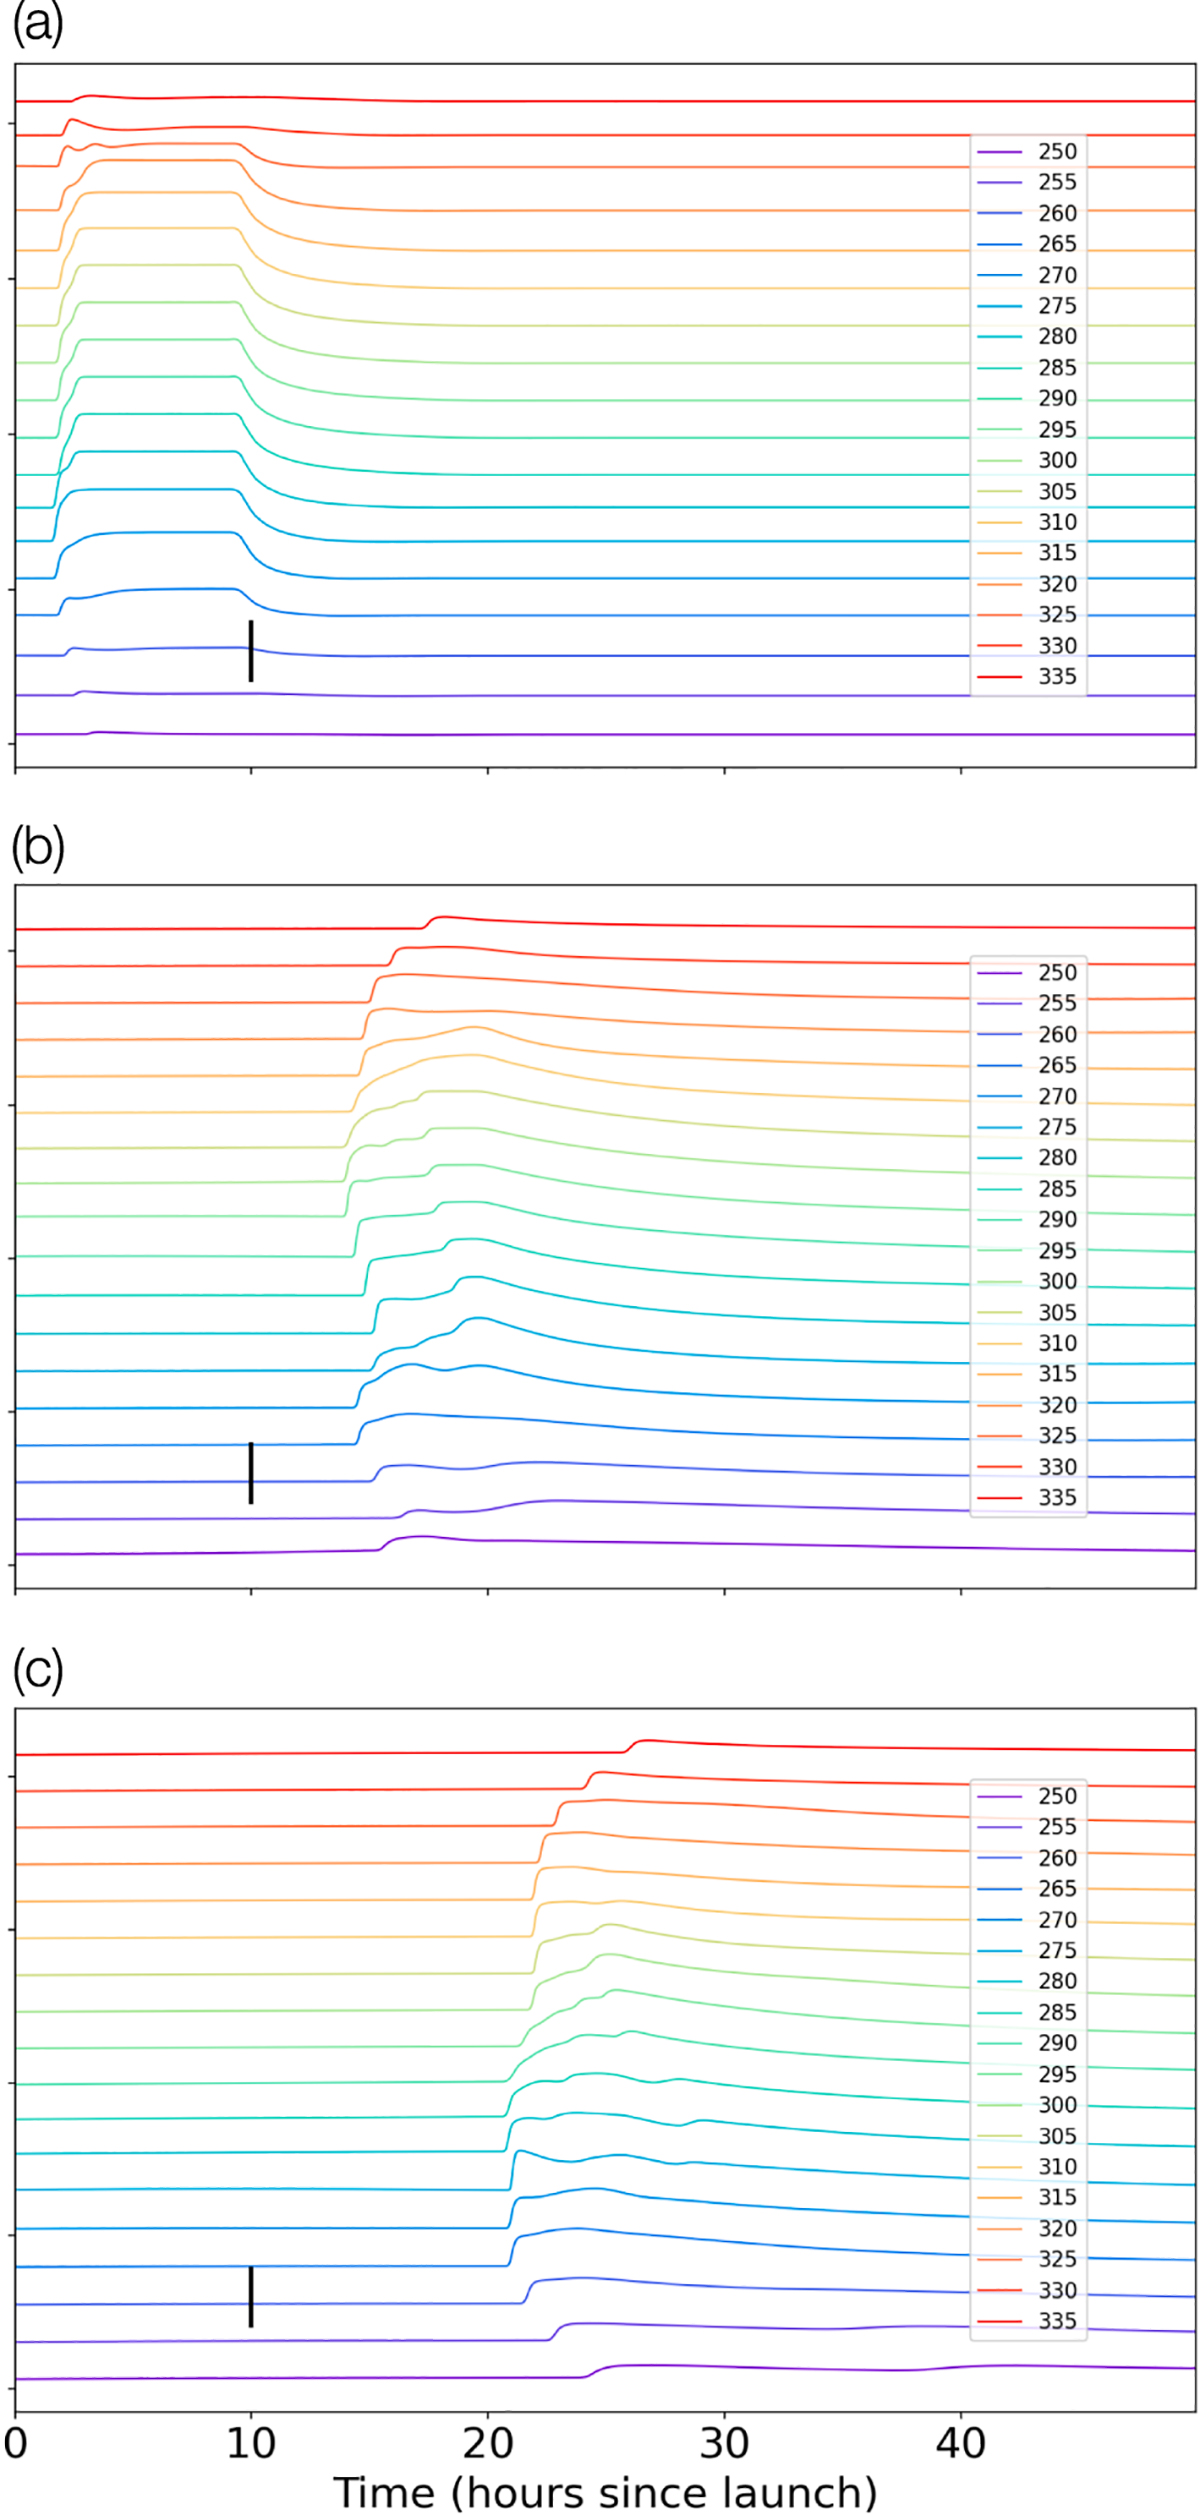
Stack plot showing radial velocity as a function of time at (a) 31R⊙, (b) 0.7 AU (orbital distance of SolO, and slightly farther away than the location of BepiColombo, at the time of the ICME), and (c) 1 AU (the orbital distance of STEREO-A and ACE), for the traces marked in Figure 7. The longitude (in degrees) of the traces is shown in the legend. Each profile is displaced by the preceding one by 1200 km/s.
Current usage metrics show cumulative count of Article Views (full-text article views including HTML views, PDF and ePub downloads, according to the available data) and Abstracts Views on Vision4Press platform.
Data correspond to usage on the plateform after 2015. The current usage metrics is available 48-96 hours after online publication and is updated daily on week days.
Initial download of the metrics may take a while.