Open Access
Figure 12
Download original image
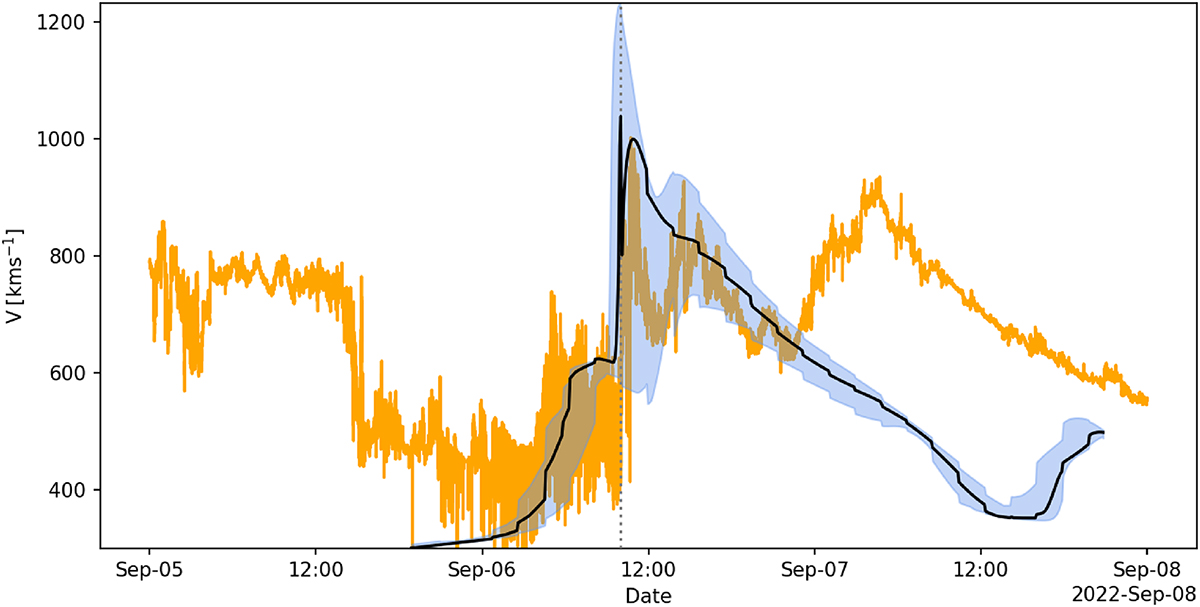
Comparison of modelled (black) and observed (orange) values of solar wind speed at the location of SolO. The blue interval marks the range of values 3° around the spacecraft trajectory, providing a measure of uncertainty in the model results. A time shift of 05:50:24 has been applied to the model results.
Current usage metrics show cumulative count of Article Views (full-text article views including HTML views, PDF and ePub downloads, according to the available data) and Abstracts Views on Vision4Press platform.
Data correspond to usage on the plateform after 2015. The current usage metrics is available 48-96 hours after online publication and is updated daily on week days.
Initial download of the metrics may take a while.