Figure 2
Download original image
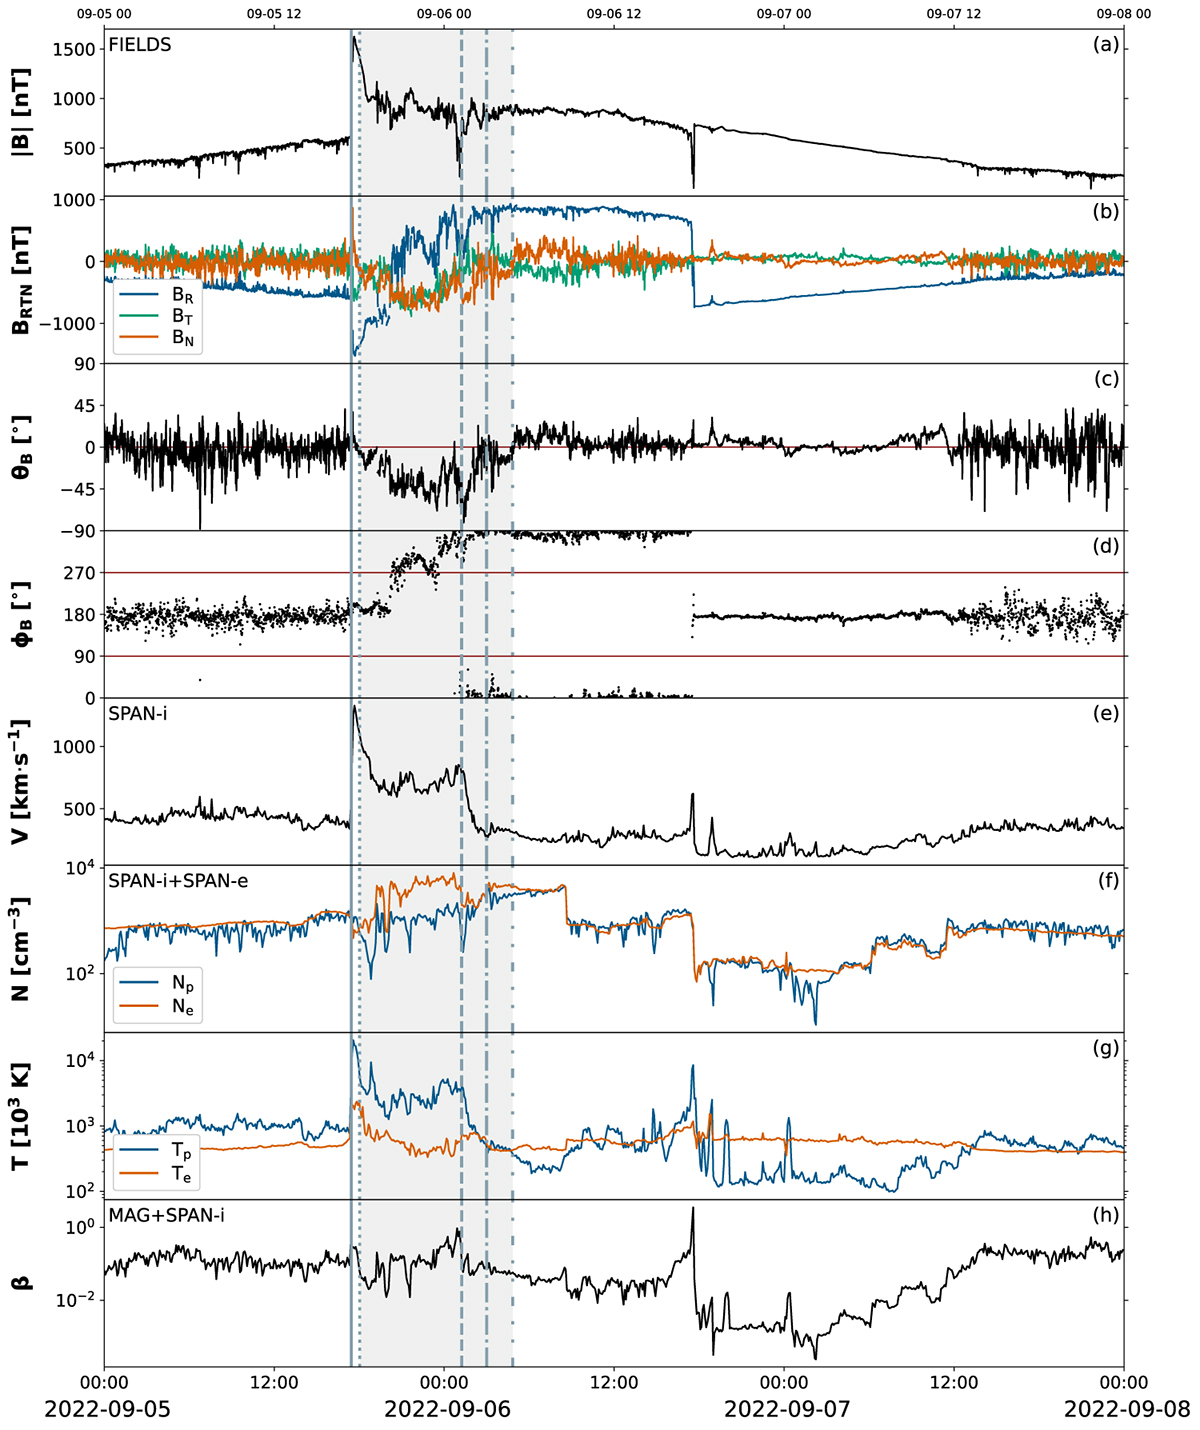
Magnetic field and plasma measurements at PSP from 2022-09-05 to 2022-09-08. From top to bottom, the panels show (a) magnetic field amplitude, (b) three components of the magnetic field (RTN); (c) and (d) the two rotation angles of the magnetic field; (e) the bulk velocity; (f) and (g) number density and temperature, as inferred from SPAN-i (blue) and SPAN-e (red); (h) plasma-β. The solid line marks the location of the fast shock driven by the CME, which is tentatively identified by the light-grey region. The leading edge of the CME is indicated by the dotted line, while three possible locations for the trailing edge are given (dashed, dash-dotted, and dash-dot-dot).
Current usage metrics show cumulative count of Article Views (full-text article views including HTML views, PDF and ePub downloads, according to the available data) and Abstracts Views on Vision4Press platform.
Data correspond to usage on the plateform after 2015. The current usage metrics is available 48-96 hours after online publication and is updated daily on week days.
Initial download of the metrics may take a while.