Figure 1
Download original image
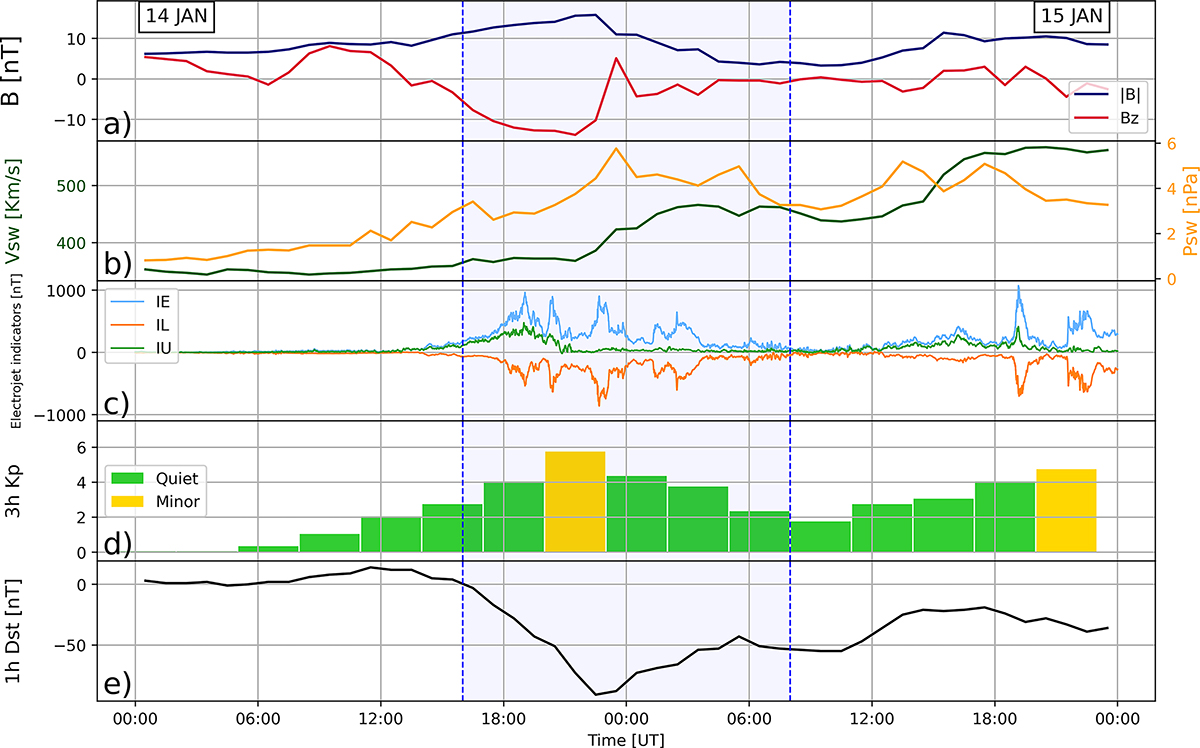
Total intensity |B| and Bz component of the IMF (Panel a), Solar Wind speed (Vsw) and pressure (Psw) (Panel b). Data in panel a and in panel b are measured at 1 AU. Other panels report the electrojet indicators IE, IL, IU in the European sector (Panel c), Kp (Panel d) and Dst (Panel e) indices during the storm. The colour code in panel d indicates the NOAA Space Weather Scale for geomagnetic storms. The blue shaded area in all panels represents the period between 16:00 UT of January, 14th and 08:30 UT of January 15th, the focus period of our analysis.
Current usage metrics show cumulative count of Article Views (full-text article views including HTML views, PDF and ePub downloads, according to the available data) and Abstracts Views on Vision4Press platform.
Data correspond to usage on the plateform after 2015. The current usage metrics is available 48-96 hours after online publication and is updated daily on week days.
Initial download of the metrics may take a while.