Figure 11
Download original image
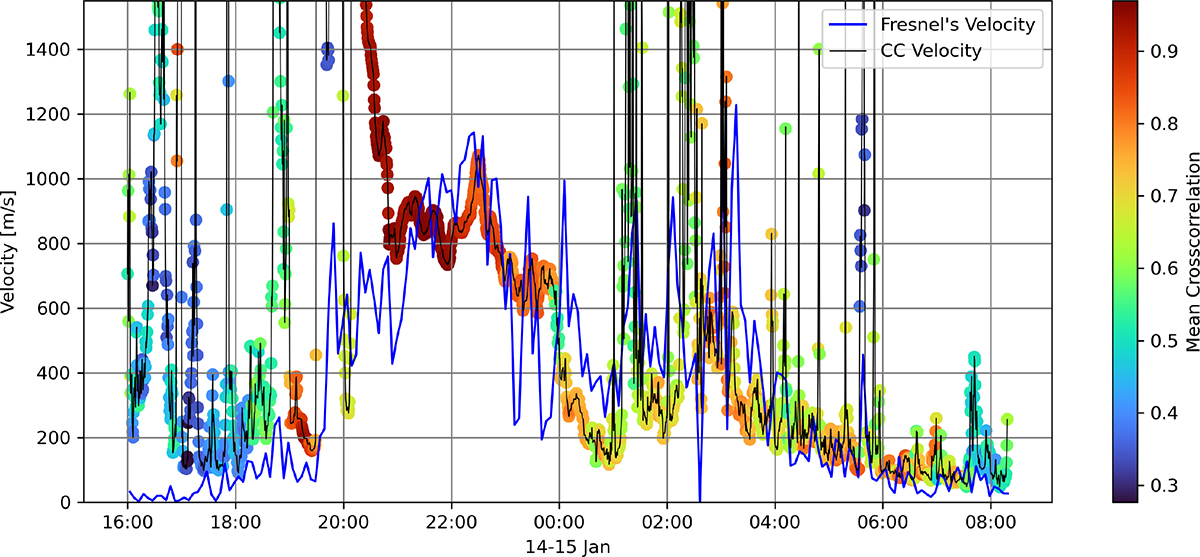
Velocity estimates during the storm by using cross-correlation (CC) and velocity from Fresnel’s Frequency identification. The blue line represents the mean velocity of all the core stations obtained using the Fresnel’s algorithm (Eq. (4)), while the black line represents the velocity obtained by the cross-correlation algorithm (Eq. (3)). Both algorithms refer to LOFAR intensity data at 60 MHz.
Current usage metrics show cumulative count of Article Views (full-text article views including HTML views, PDF and ePub downloads, according to the available data) and Abstracts Views on Vision4Press platform.
Data correspond to usage on the plateform after 2015. The current usage metrics is available 48-96 hours after online publication and is updated daily on week days.
Initial download of the metrics may take a while.