Figure 12
Download original image
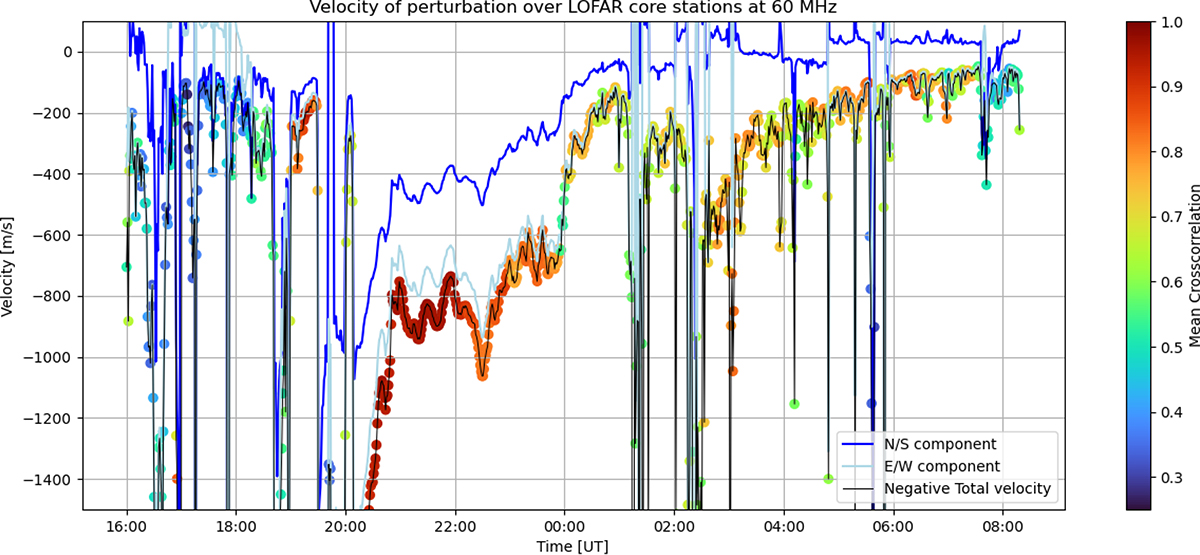
Components (blue for North–South, light blue for East–West) and magnitude (black) of the velocity measured by the LOFAR core stations. The negative sign represents a wave propagating from East to West and from North to South. The colour code represented the mean cross-correlation coming from all the baselines every 30 s.We applied the algorithm to LOFAR intensity data at 60 MHz.
Current usage metrics show cumulative count of Article Views (full-text article views including HTML views, PDF and ePub downloads, according to the available data) and Abstracts Views on Vision4Press platform.
Data correspond to usage on the plateform after 2015. The current usage metrics is available 48-96 hours after online publication and is updated daily on week days.
Initial download of the metrics may take a while.