Figure 13
Download original image
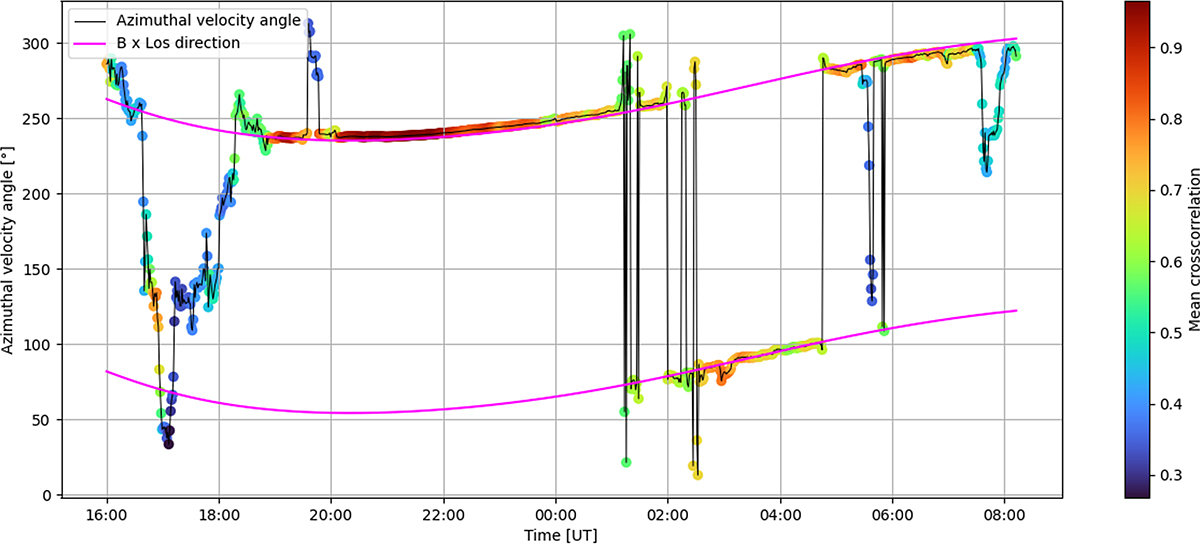
Direction of the ionospheric velocity measured using the LOFAR power data in terms of the azimuthal angle of the velocity. The colour represents the mean cross-correlation of all the baselines every 30 s while the magenta lines represent the possible azimuthal angle of ![]() . vector. We applied the algorithm to LOFAR intensity data at 60 MHz.
. vector. We applied the algorithm to LOFAR intensity data at 60 MHz.
Current usage metrics show cumulative count of Article Views (full-text article views including HTML views, PDF and ePub downloads, according to the available data) and Abstracts Views on Vision4Press platform.
Data correspond to usage on the plateform after 2015. The current usage metrics is available 48-96 hours after online publication and is updated daily on week days.
Initial download of the metrics may take a while.