Figure 15
Download original image
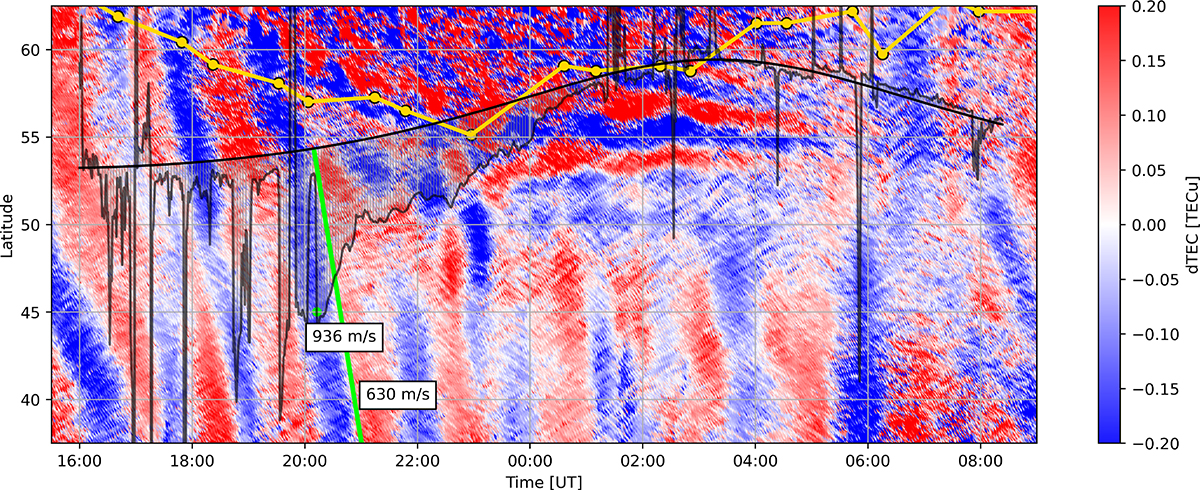
Keogram reporting the latitudinal distribution of the dTEC from 35° to 65° N for the time interval 15:30 to 09:00 between January 14th and 15th, 2022. The yellow line represents the position of the lower boundary of the auroral oval. The black line represents the latitude of the LOFAR observation projected at an IPP of 350 km. The gray segments represent the Latitudinal component of the velocity measure at the corresponding time; one degree corresponds to 100 m/s. The green segment highlights the alternations of positive and negative dTEC, showing the presence of a TID. The green dot represents the velocity measured by LOFAR at the same time and latitude as the TID seen by GNSS.
Current usage metrics show cumulative count of Article Views (full-text article views including HTML views, PDF and ePub downloads, according to the available data) and Abstracts Views on Vision4Press platform.
Data correspond to usage on the plateform after 2015. The current usage metrics is available 48-96 hours after online publication and is updated daily on week days.
Initial download of the metrics may take a while.