Figure 5
Download original image
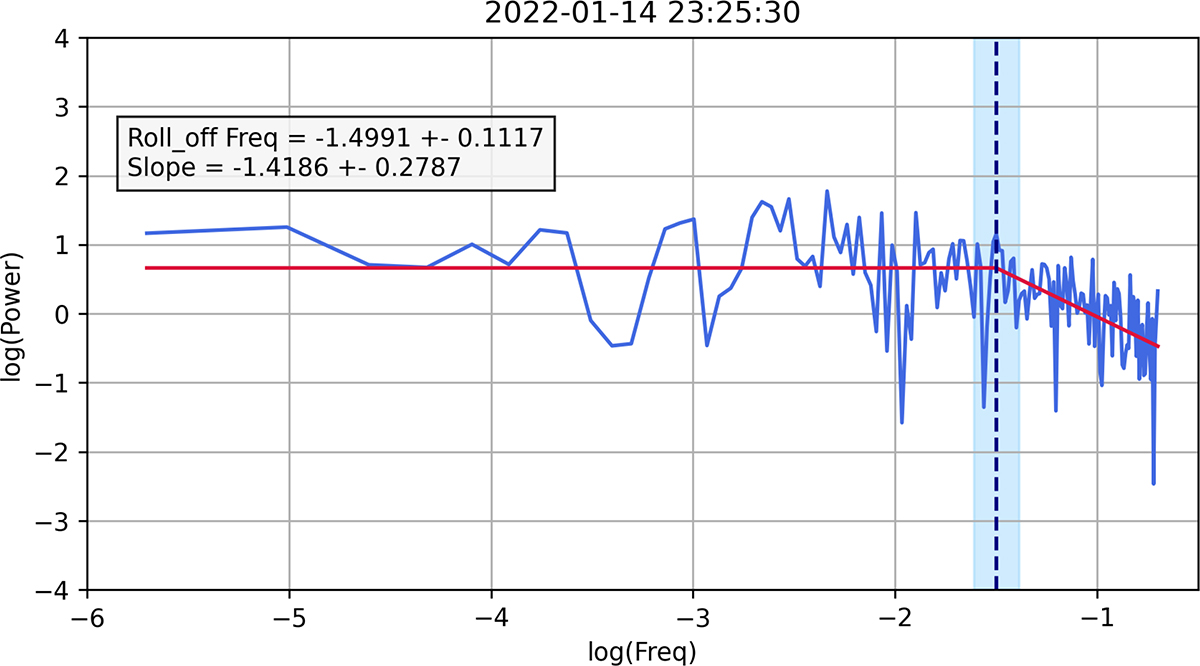
Example of roll-off frequency estimation from the PSD based on FFT of 5 min of data between 23:22:30 UT and 23:27:30 UT of January 14th. The blue line represents the log-log spectrum, while the red line shows the fitted function following equation (5). The roll-off frequency is indicated by the dashed blue line, while its standard deviation is represented by the light blue box around it. In the gray box, we report the best fit values and their standard deviation for the constant, the slope and the intercept of equation (5).
Current usage metrics show cumulative count of Article Views (full-text article views including HTML views, PDF and ePub downloads, according to the available data) and Abstracts Views on Vision4Press platform.
Data correspond to usage on the plateform after 2015. The current usage metrics is available 48-96 hours after online publication and is updated daily on week days.
Initial download of the metrics may take a while.