Figure 8
Download original image
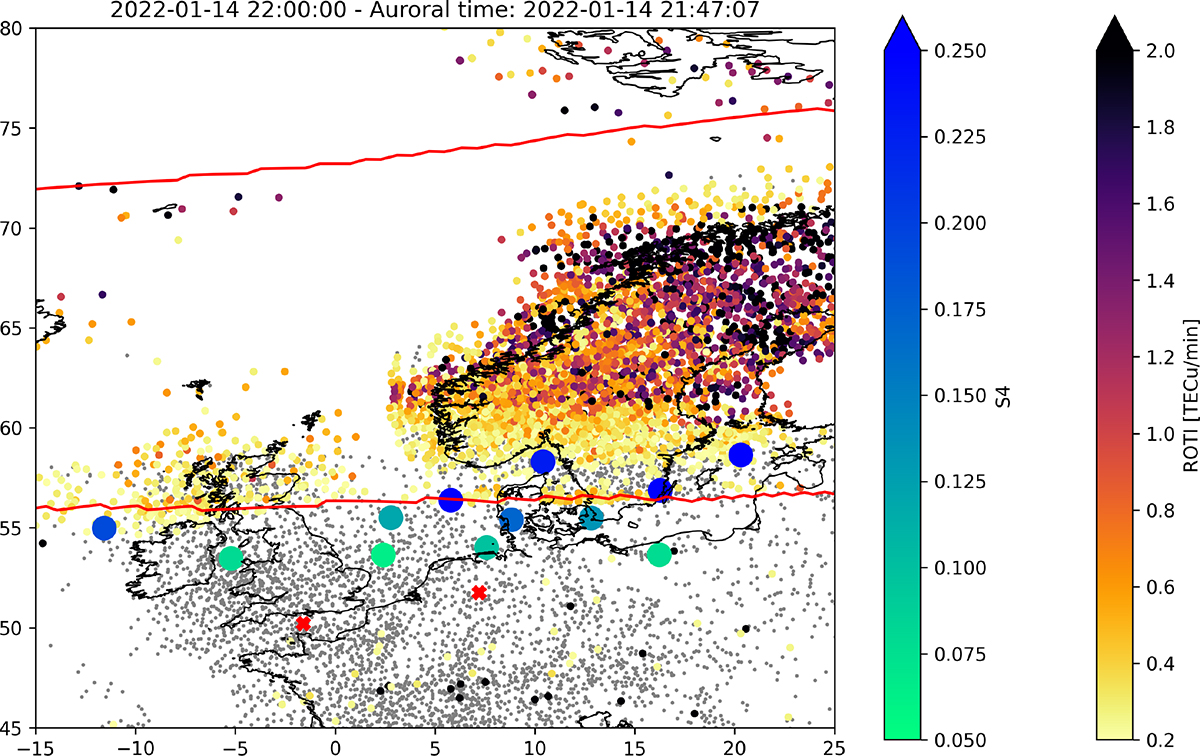
Map of the ionospheric irregularities measured around 22:00 UT of January14th over the European sector at latitudes between 45° and 80° N and longitudes between −15° and 25° E. The red lines represent the boundaries of the auroral oval modelled by the DMSP. The ROTI data are represented in the yellow–black scale if over the threshold of 0.2 TECU/min or as simple gray dots if under it. The LOFAR S4 follow the same logic with a threshold of 0.05 and a scale green/blue and red “x”.
Current usage metrics show cumulative count of Article Views (full-text article views including HTML views, PDF and ePub downloads, according to the available data) and Abstracts Views on Vision4Press platform.
Data correspond to usage on the plateform after 2015. The current usage metrics is available 48-96 hours after online publication and is updated daily on week days.
Initial download of the metrics may take a while.