Figure 9
Download original image
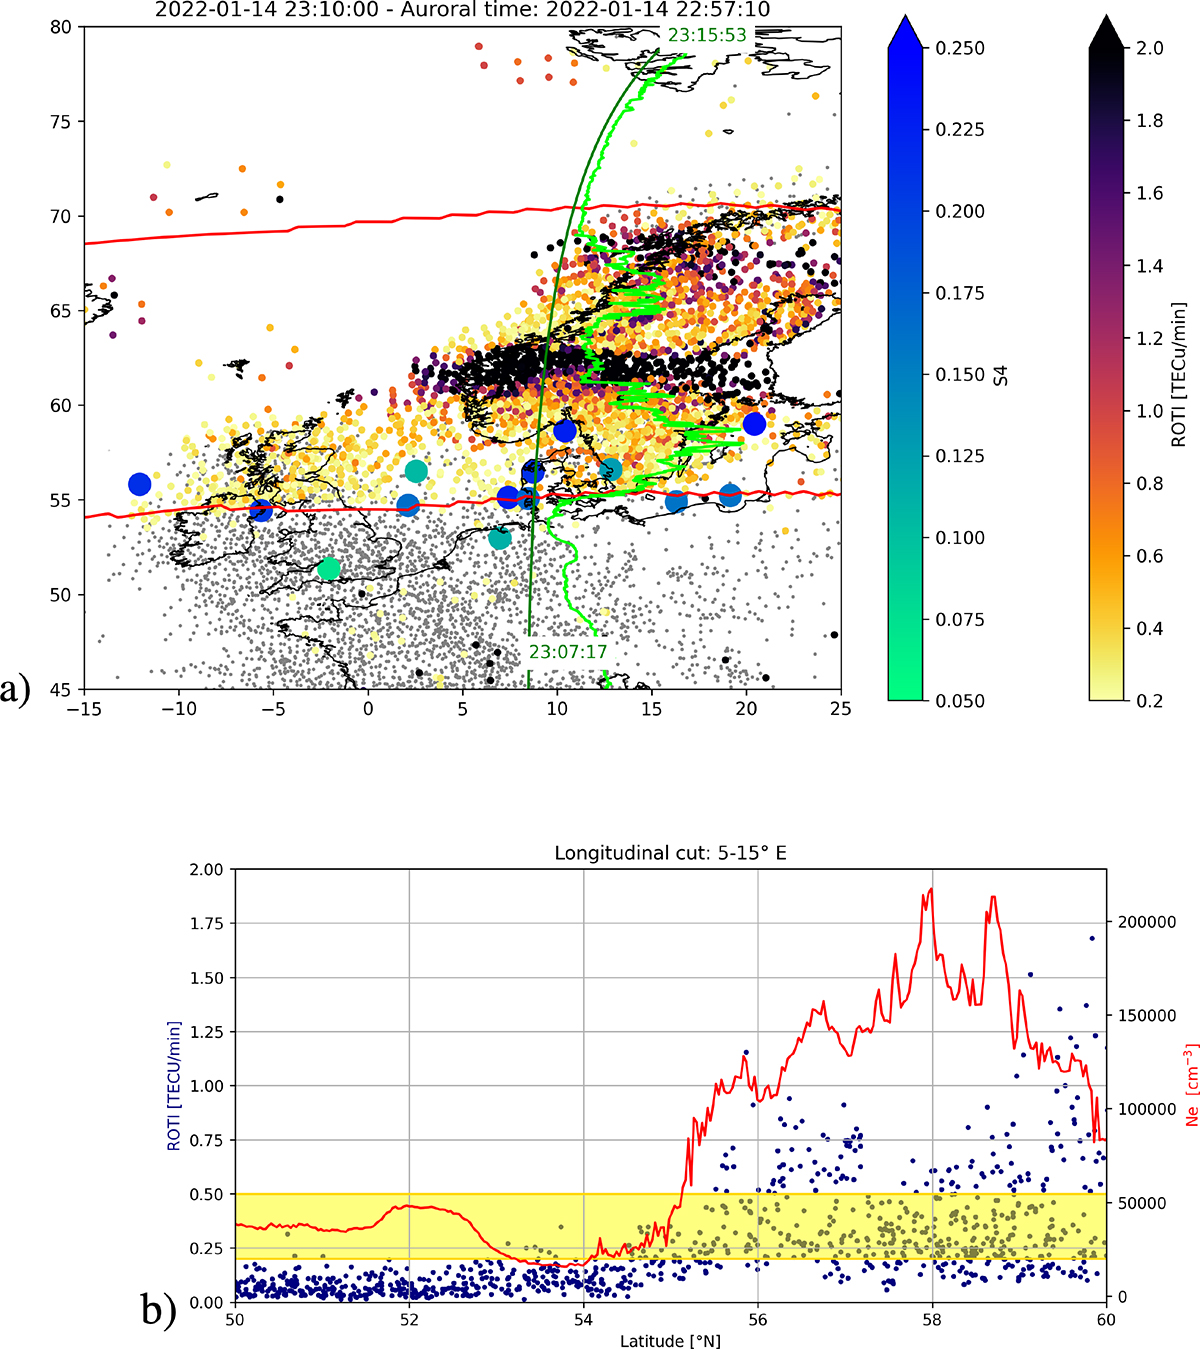
Plot a) shows the map of the ionospheric irregularities measured around 23:10 UT of January14th over the European sector at latitudes between 45° and 80° N and longitudes between −15° and 25° E. The dark green line represents the trajectory of the Swarm Bravo satellite passing over Europe, from South to North, between 23:07 UT and 23:16 UT on January 14th. The light green line indicates the in-situ plasma density of Swarm Bravo, with a higher longitudinal positive deviation from the ground track, the higher the plasma density is. The other variables follow the same colour description as Figures 7 and 8. Plot b) shows the in-situ electron density measured by Swarm Bravo (red line) between 23:07 UT and 23:16 UT of January 14th over the European sector. The blue dots represent the ROTI values measured by the GNSS. The yellow band represents the enhancement of ROTI between 0.2 and 0.5 TECU/min due to the presence of the poleward boundary of the ionospheric trough.
Current usage metrics show cumulative count of Article Views (full-text article views including HTML views, PDF and ePub downloads, according to the available data) and Abstracts Views on Vision4Press platform.
Data correspond to usage on the plateform after 2015. The current usage metrics is available 48-96 hours after online publication and is updated daily on week days.
Initial download of the metrics may take a while.