Open Access
Figure 13
Download original image
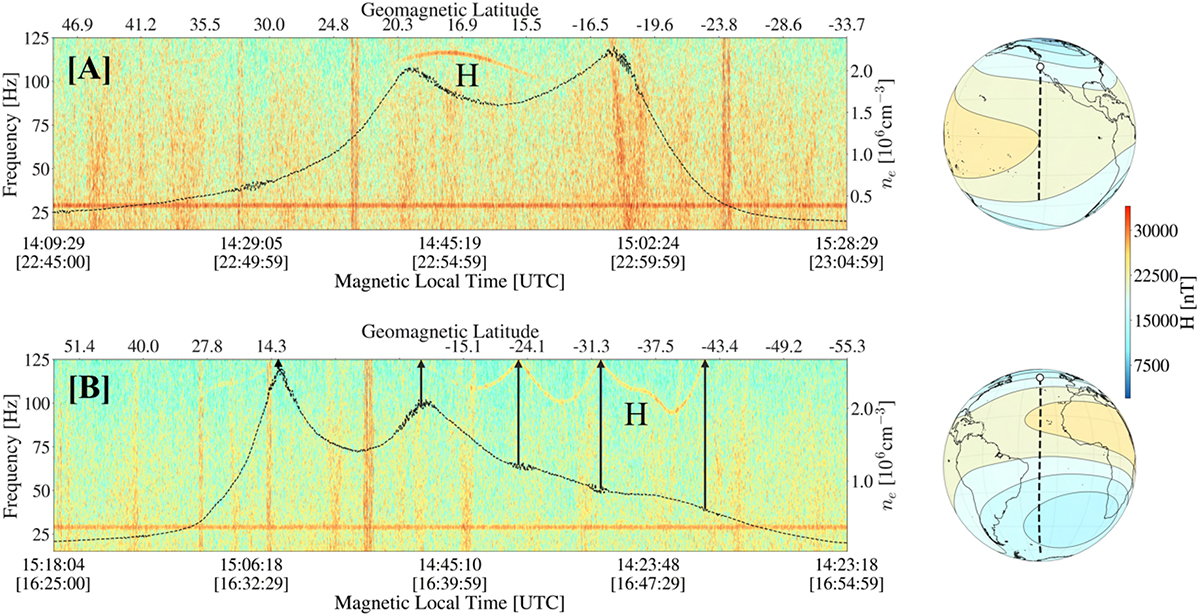
As for Figure 3, an example of (A) a typical hook-like signal (H) observed in Swarm burst-mode data and (B) demonstration of contemporaneous plasma density (dashed line) irregularities and modulation of a long-lasting hook. Both examples are from burst-mode data on 05-Oct-2023.
Current usage metrics show cumulative count of Article Views (full-text article views including HTML views, PDF and ePub downloads, according to the available data) and Abstracts Views on Vision4Press platform.
Data correspond to usage on the plateform after 2015. The current usage metrics is available 48-96 hours after online publication and is updated daily on week days.
Initial download of the metrics may take a while.