Figure 4
Download original image
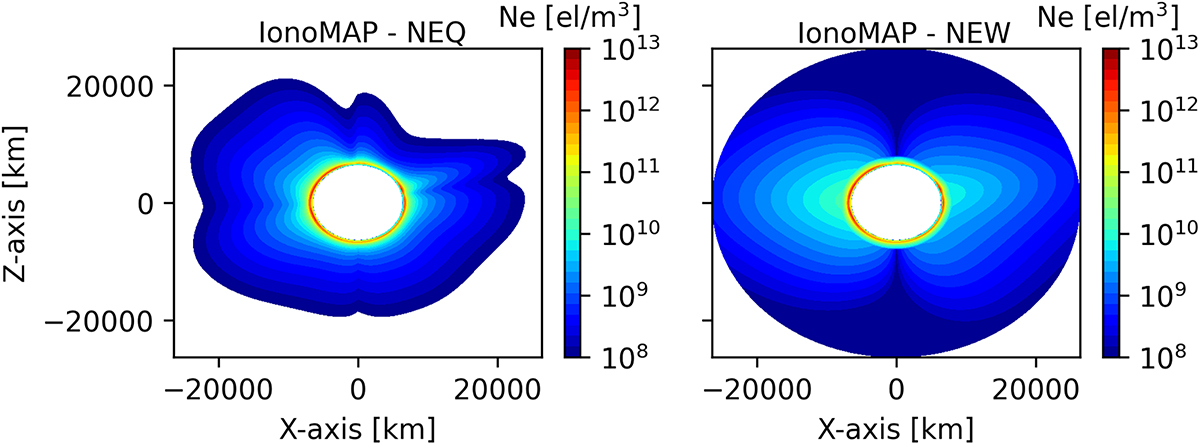
Meridional cuts of the ionosphere and plasmasphere based on the developed models. The result obtained with NeQuick 2 formulation is shown in the left panel, while the new formulation is shown in the right panel. The color bar is shown in logarithmic scale for better visibility. The representation is provided in geographic coordinates on December 30, 2013, at 00:00 UT for a longitude of 0° and 180°.
Current usage metrics show cumulative count of Article Views (full-text article views including HTML views, PDF and ePub downloads, according to the available data) and Abstracts Views on Vision4Press platform.
Data correspond to usage on the plateform after 2015. The current usage metrics is available 48-96 hours after online publication and is updated daily on week days.
Initial download of the metrics may take a while.