Open Access
Figure 8
Download original image
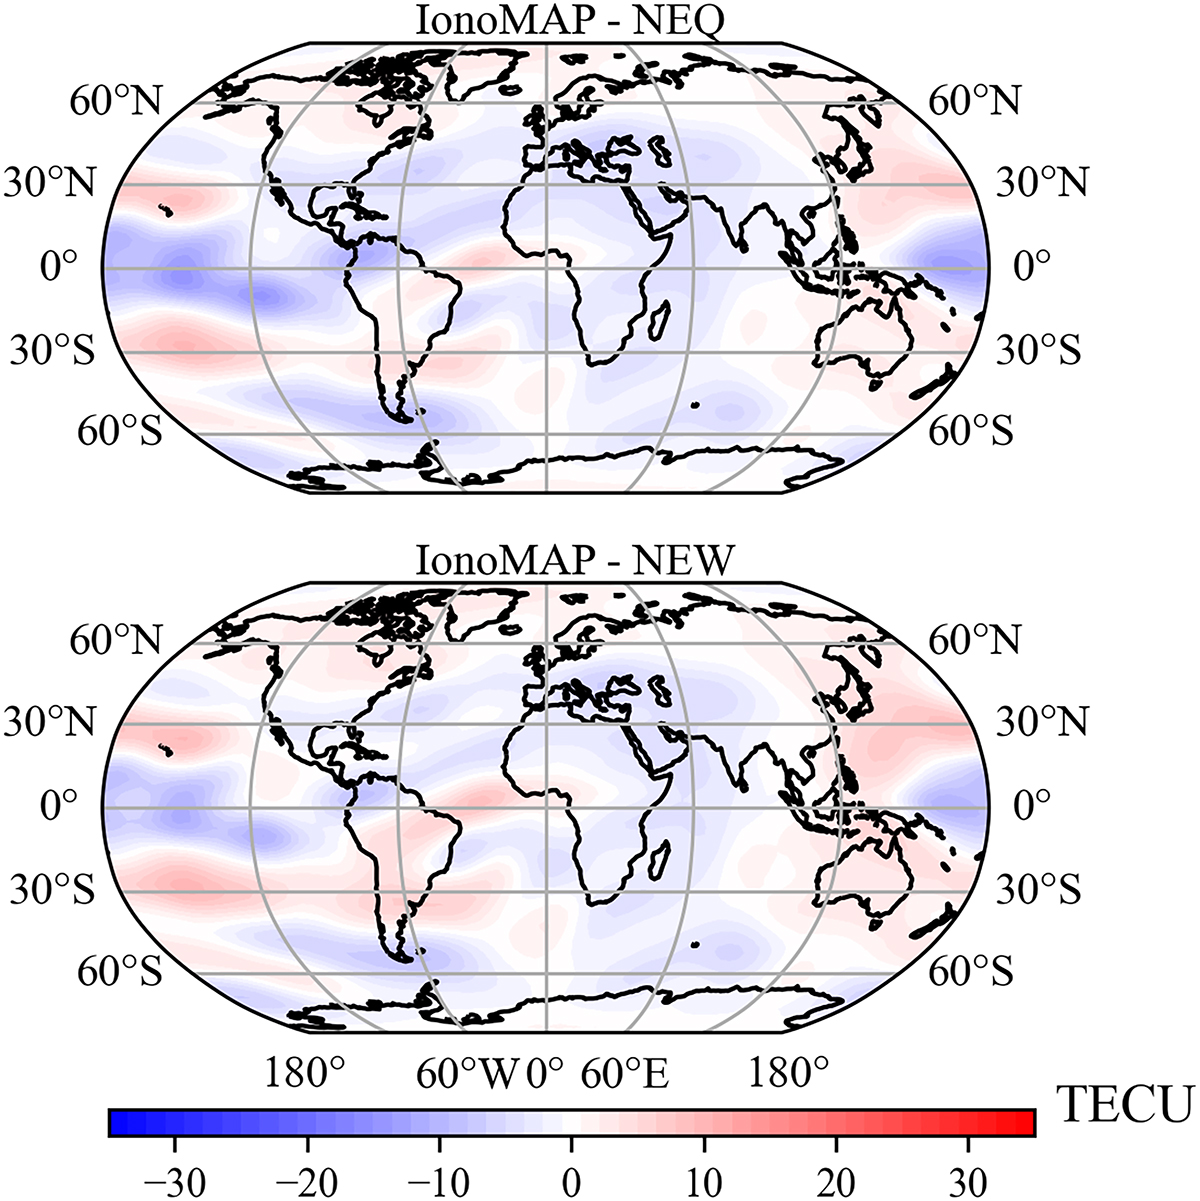
Difference between VTEC values derived by global ionospheric maps of IonoMAP and CODE. Top panel is obtained with the NeQuick 2 formulation for the topside ionosphere and the bottom panel is obtained with the new formulation. Maps are related to January 1st, 2008, at 00:00 hours UT.
Current usage metrics show cumulative count of Article Views (full-text article views including HTML views, PDF and ePub downloads, according to the available data) and Abstracts Views on Vision4Press platform.
Data correspond to usage on the plateform after 2015. The current usage metrics is available 48-96 hours after online publication and is updated daily on week days.
Initial download of the metrics may take a while.