Figure 1
Download original image
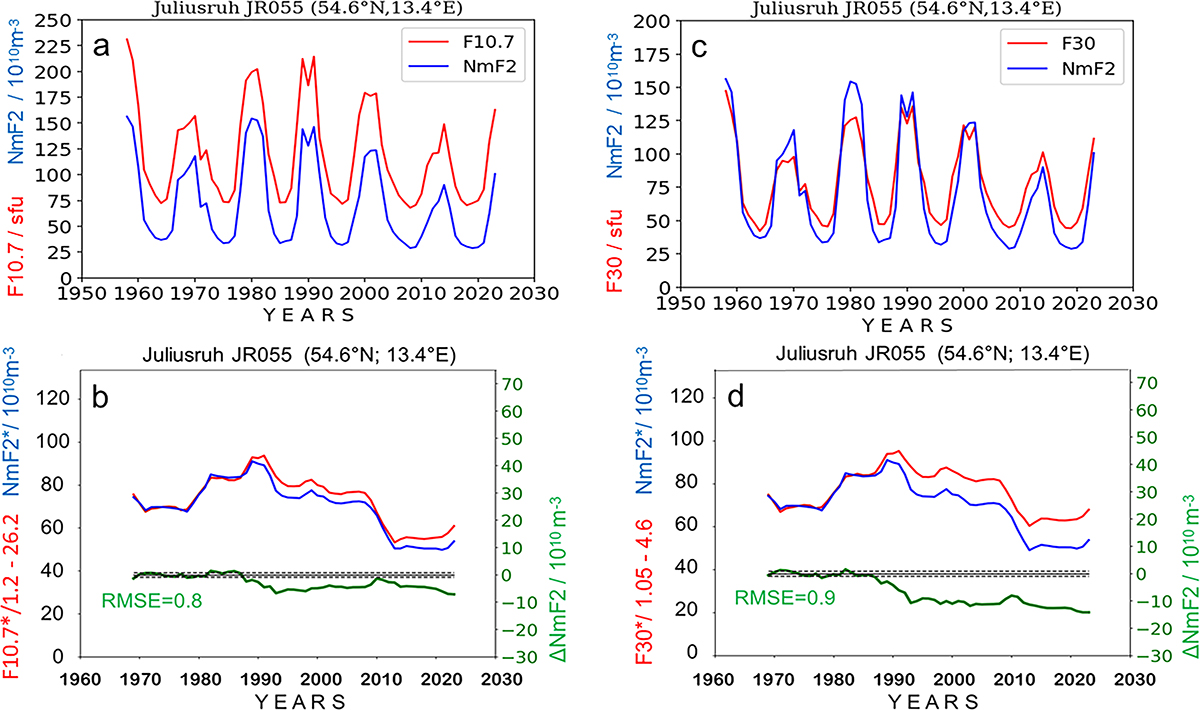
Long-term behavior of NmF2 over the German ionosonde station Juliusruh in comparison with solar radio flux indices F10.7 (a, b) and F30 (c, d). Panels a and c: Yearly means of NmF2 monthly medians and solar indices F10.7 (a) and F30 (b). Panels b and d: Sliding solar cycle averages (previous 11 years) of NmF2 estimates (NmF2*) and linear models of NmF2* (until 1984) run by sliding solar cycle averages of F10.7 (F10.7*) and F30 (F30*). The differences between observations and linear NmF2* models, ΔNmF2, are plotted in the lower part. scaled at the right side. The dashed lines indicate the RMS ± error (RMSE) range of the linear models taken as reference.
Current usage metrics show cumulative count of Article Views (full-text article views including HTML views, PDF and ePub downloads, according to the available data) and Abstracts Views on Vision4Press platform.
Data correspond to usage on the plateform after 2015. The current usage metrics is available 48-96 hours after online publication and is updated daily on week days.
Initial download of the metrics may take a while.