Figure 5
Download original image
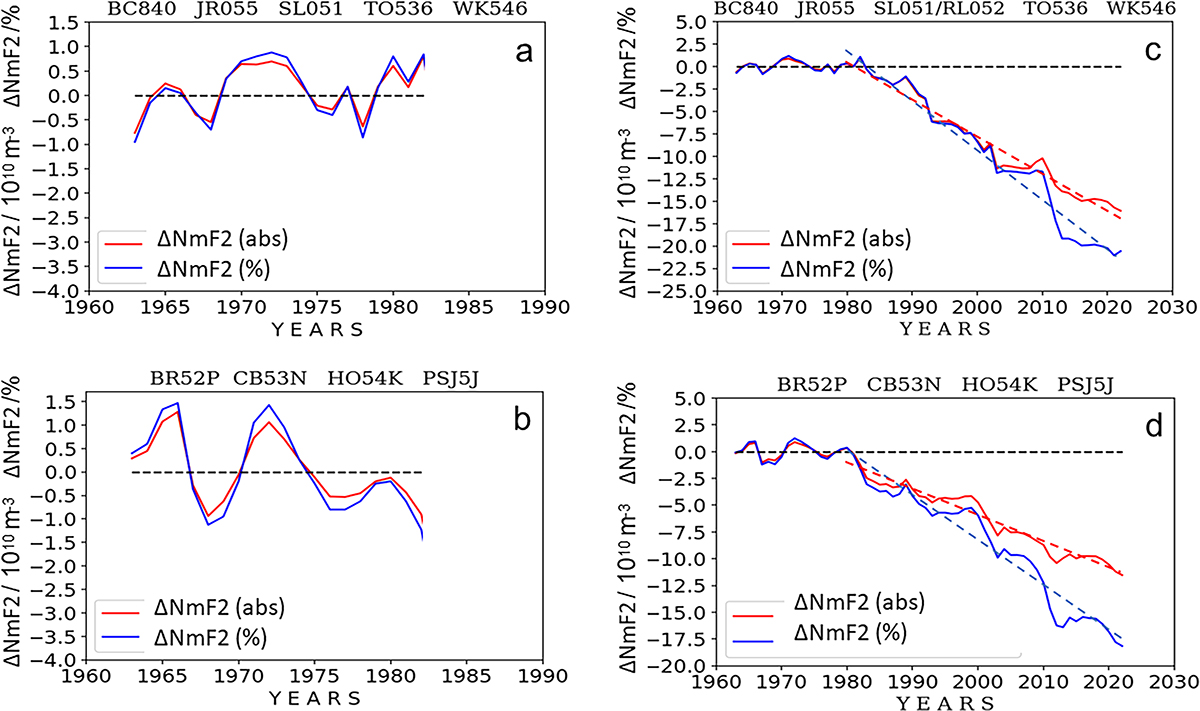
Mean differences ΔNmF2 between estimates of NmF2* at ionosonde stations in the Northern (a and c) and Southern (b and d) hemispheres and corresponding models LM(NmF2*) as a function of F30*. Panels a and b zoom in on the early phase of measurements until 1982. Panels c and d show differences between the linear NmF2* models and observations over the full period 1963–2022, including linear regression lines starting in 1980.
Current usage metrics show cumulative count of Article Views (full-text article views including HTML views, PDF and ePub downloads, according to the available data) and Abstracts Views on Vision4Press platform.
Data correspond to usage on the plateform after 2015. The current usage metrics is available 48-96 hours after online publication and is updated daily on week days.
Initial download of the metrics may take a while.