Figure 6
Download original image
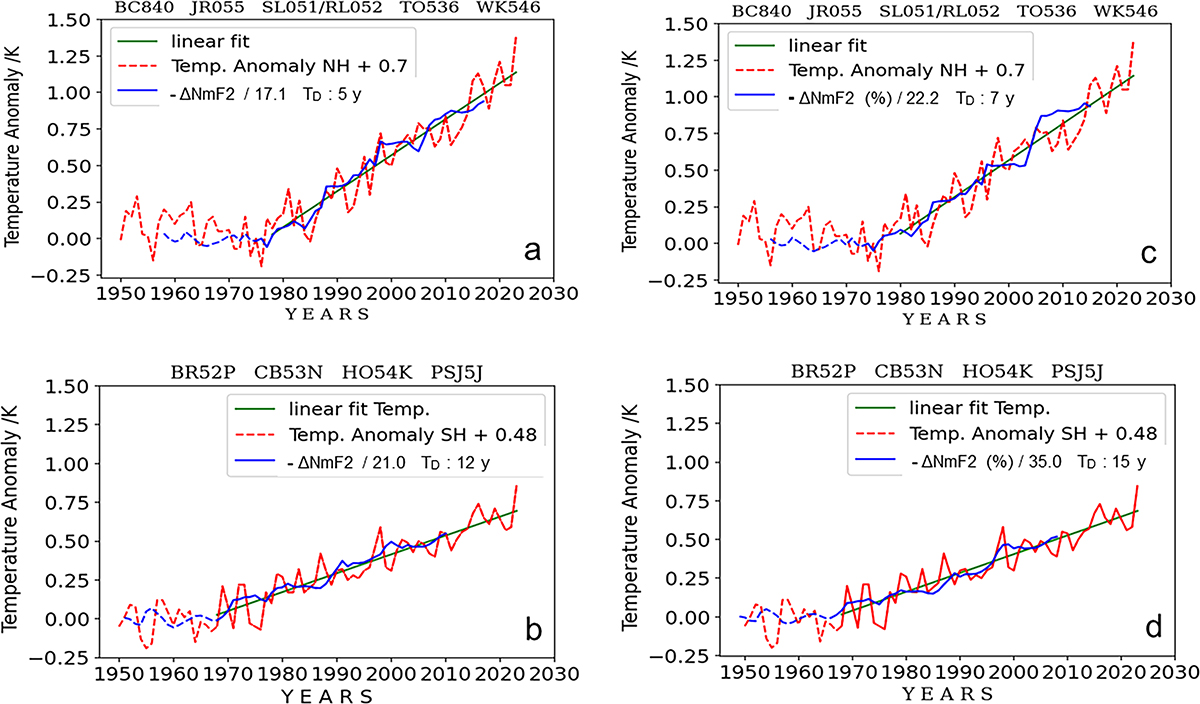
Temperature anomaly (TA) at the Earth’s surface at both hemispheres (red dashed line). Linear regressions of the TA are fitted by the EDA anomaly averages (absolute at panels a and b and percentage at panels c and d) computed from the combined data of ionosonde stations Boulder, Juliusruh, Slough/Chilton Kokubunji and Wakkanai in the Northern hemisphere (panels a and c) and by the ionosonde stations Brisbane, Canberra, Hobart and Port Stanley from the Southern hemisphere (panels b and d). To get a coincidence of linear fits for TA and EDA, absolute EDA averages have been scaled by a divisor as indicated and offset by several years indicated by TD in the plots.
Current usage metrics show cumulative count of Article Views (full-text article views including HTML views, PDF and ePub downloads, according to the available data) and Abstracts Views on Vision4Press platform.
Data correspond to usage on the plateform after 2015. The current usage metrics is available 48-96 hours after online publication and is updated daily on week days.
Initial download of the metrics may take a while.