Figure 12
Download original image
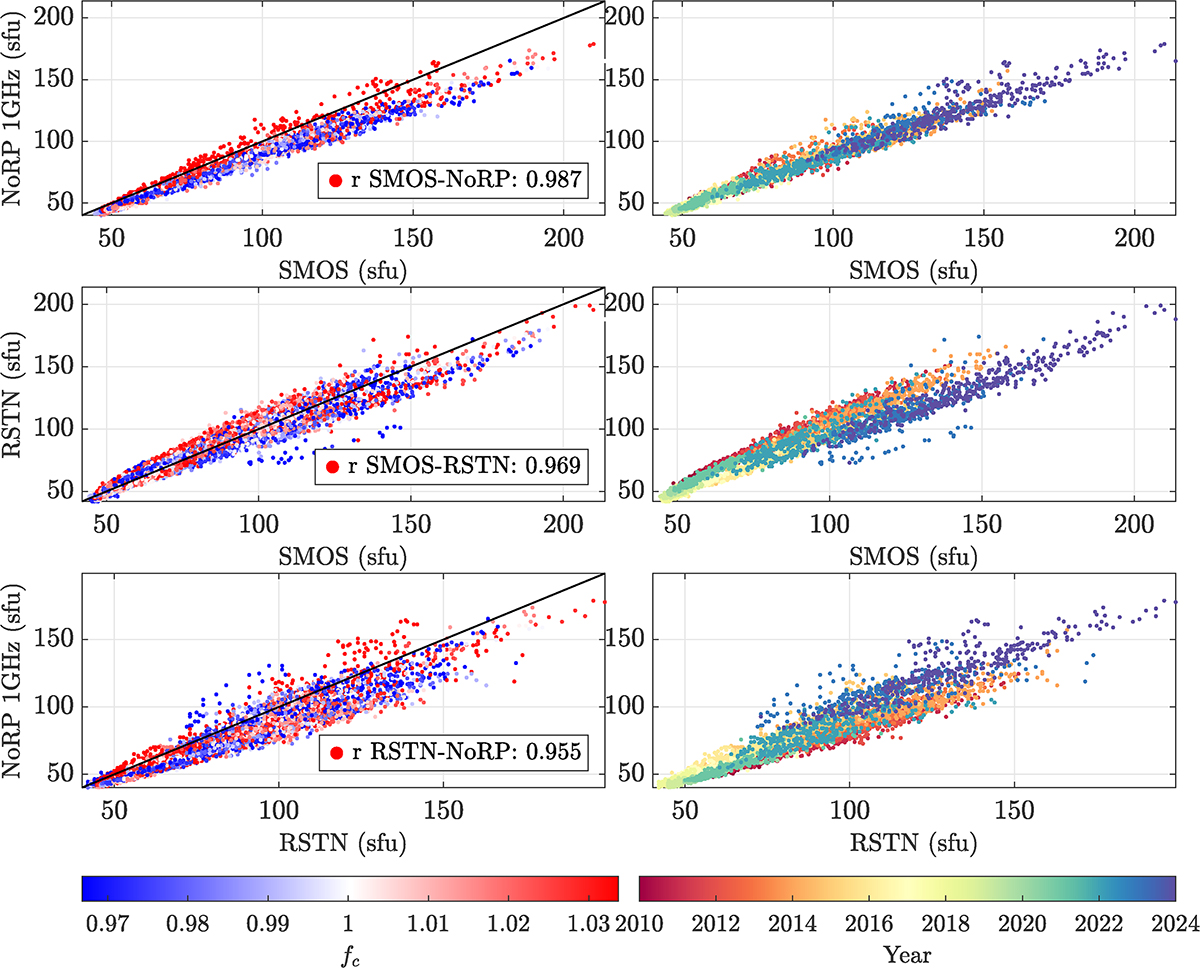
Nobeyama 1 GHz, composite RSTN, and SMOS (front) daily solar flux comparison. Left-most plots provide seasonal information with respect to the Sun-Earth distance correction. Yearly evolution is represented on the right. Pearson correlation coefficients between each pair and quadrant bisectors are reported on left-most plots.
Current usage metrics show cumulative count of Article Views (full-text article views including HTML views, PDF and ePub downloads, according to the available data) and Abstracts Views on Vision4Press platform.
Data correspond to usage on the plateform after 2015. The current usage metrics is available 48-96 hours after online publication and is updated daily on week days.
Initial download of the metrics may take a while.