Open Access
Figure 11
Download original image
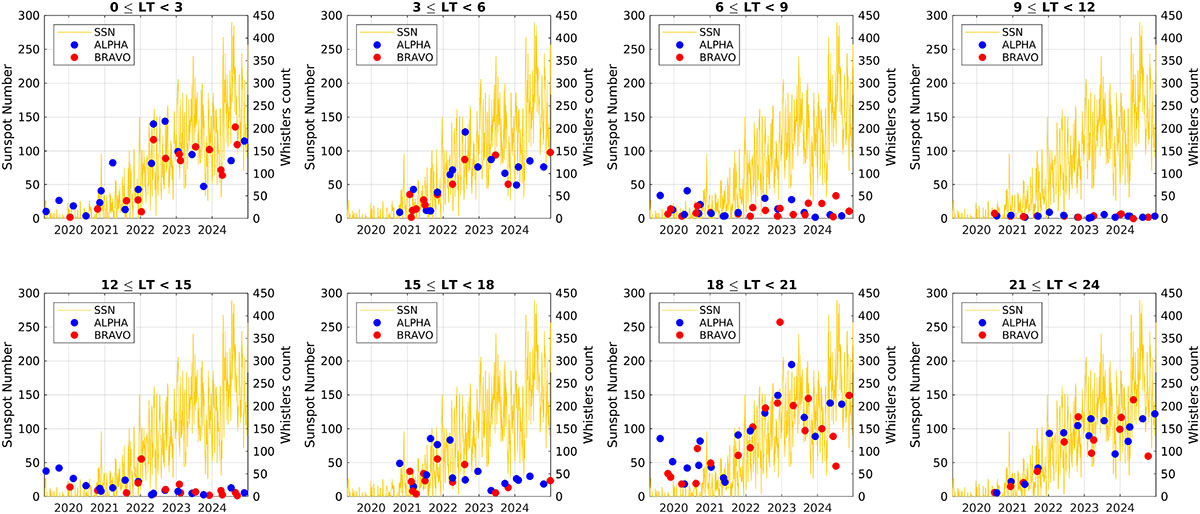
Median over each burst mode campaign of the number of whistlers detected in a local time sector per day, compared with the daily sunspot numbers. Each panel contains data sampled in a local time sector of 3 h.
Current usage metrics show cumulative count of Article Views (full-text article views including HTML views, PDF and ePub downloads, according to the available data) and Abstracts Views on Vision4Press platform.
Data correspond to usage on the plateform after 2015. The current usage metrics is available 48-96 hours after online publication and is updated daily on week days.
Initial download of the metrics may take a while.