Figure 4
Download original image
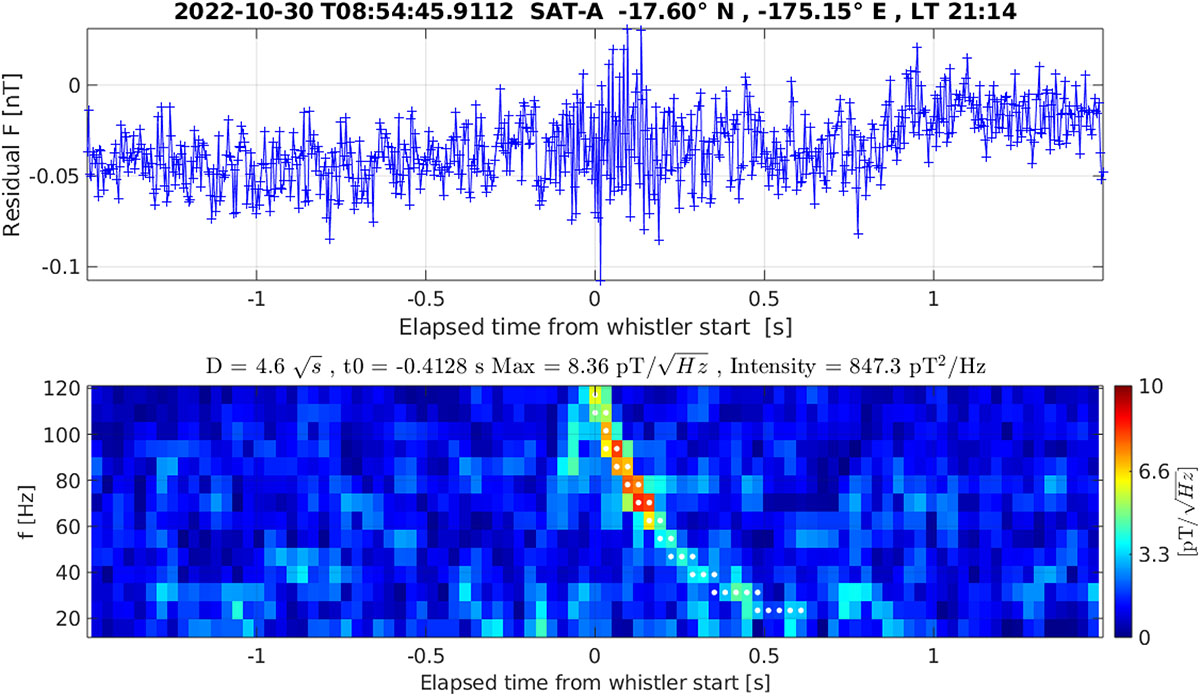
Example of whistler event as provided in the Swarm Level 2 data product. Top panel, residual magnetic field intensity after removing the large-scale trends with a degree 4 polynomial. Bottom panel: ASD of the signal, with superposed white dots indicating the tiles retained for whistler characterisation following Eckersley dispersion.
Current usage metrics show cumulative count of Article Views (full-text article views including HTML views, PDF and ePub downloads, according to the available data) and Abstracts Views on Vision4Press platform.
Data correspond to usage on the plateform after 2015. The current usage metrics is available 48-96 hours after online publication and is updated daily on week days.
Initial download of the metrics may take a while.