Figure 12
Download original image
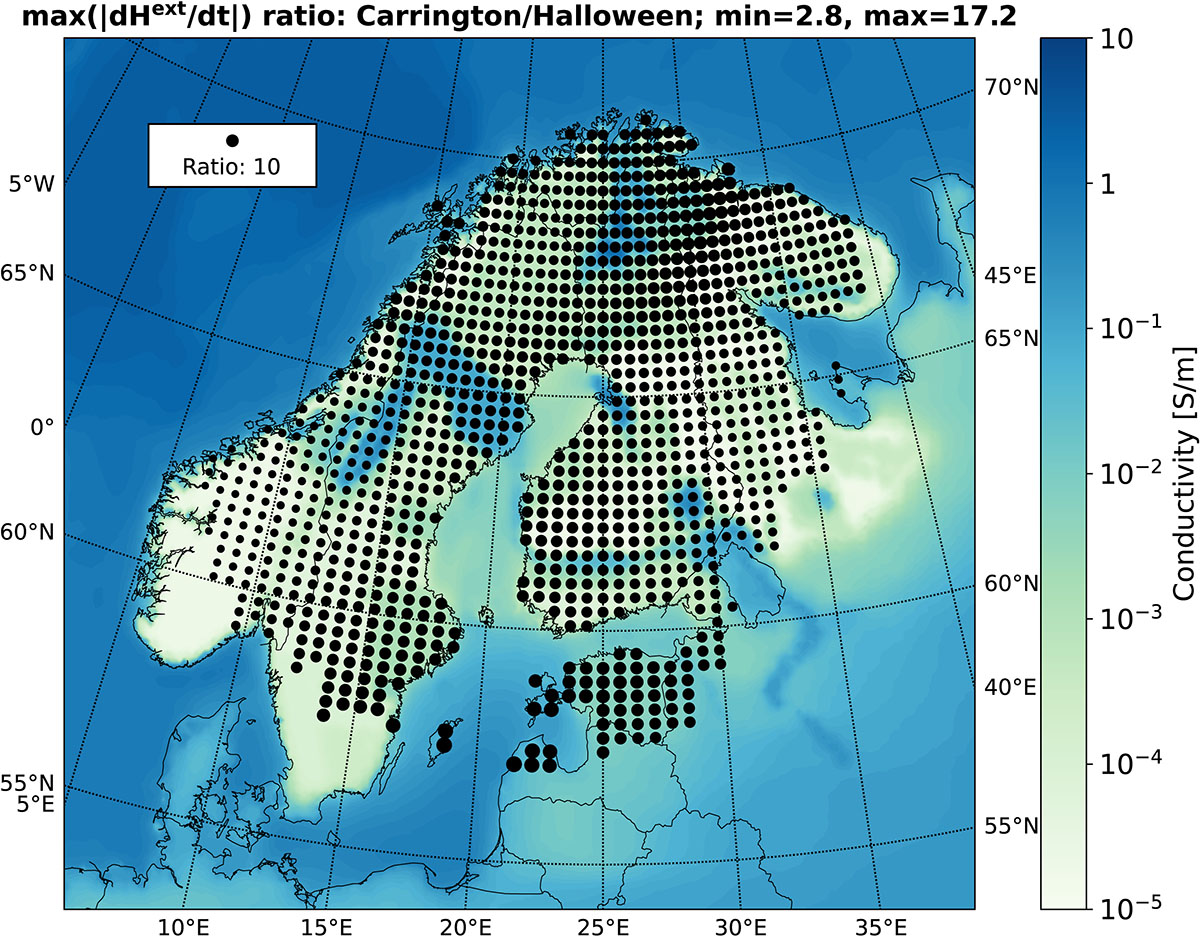
The ratio between maximum external magnetic field time derivatives during the Carrington and Halloween storms (black points), along with conductivity distribution (in S/m) in the upper layer of the conductivity model of Fennoscandia used for the geoelectric field simulation. For visual clarity, the ratio is shown only for 1% of points considered in the analysis.
Current usage metrics show cumulative count of Article Views (full-text article views including HTML views, PDF and ePub downloads, according to the available data) and Abstracts Views on Vision4Press platform.
Data correspond to usage on the plateform after 2015. The current usage metrics is available 48-96 hours after online publication and is updated daily on week days.
Initial download of the metrics may take a while.