Figure B1
Download original image
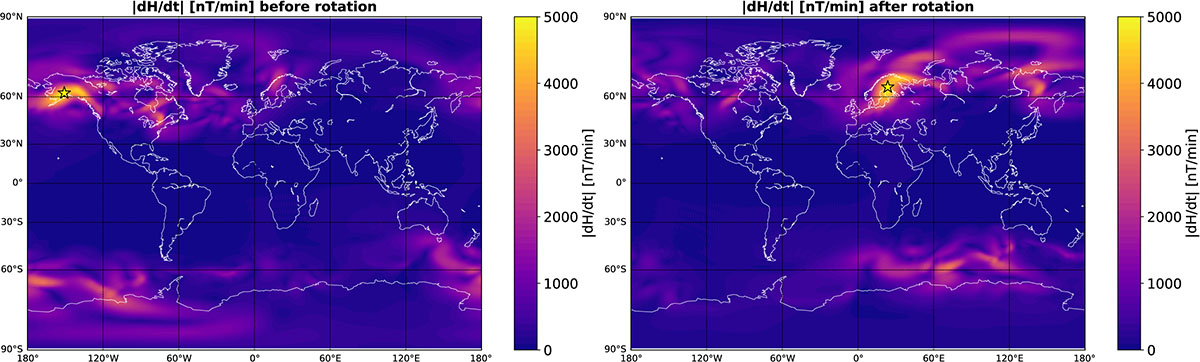
Time derivative of the horizontal external magnetic field |dH/dt| in geographic coordinates at 06:31 UT, 2 Sep 1859 (the moment of the largest |dH/dt| during the Carrington event simulation), before (left) and after 150° westward rotation (right) with respect to the geomagnetic dipole axis. The yellow star indicates the point with the largest simulated |dH/dt|. dX/dt and dY/dt time series at this point are shown in Figure 5. The transformation from the geomagnetic to geographic coordinate system was performed using the position of the geomagnetic north pole in 2025 according to the IGRF model (80.8° N, 72.8° W).
Current usage metrics show cumulative count of Article Views (full-text article views including HTML views, PDF and ePub downloads, according to the available data) and Abstracts Views on Vision4Press platform.
Data correspond to usage on the plateform after 2015. The current usage metrics is available 48-96 hours after online publication and is updated daily on week days.
Initial download of the metrics may take a while.