Figure 7
Download original image
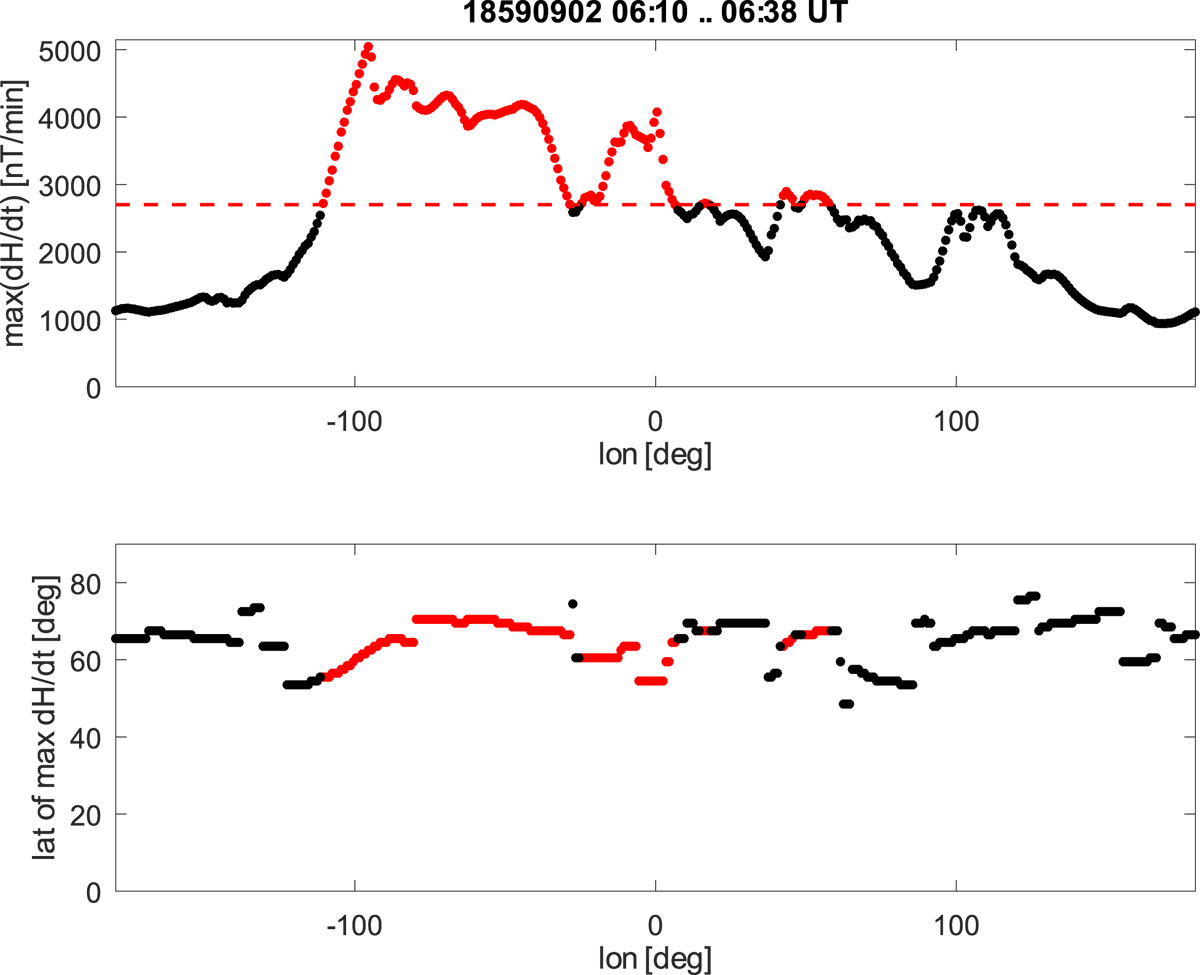
Upper panel: The largest time derivative of the horizontal ground magnetic field (|dH/dt|) along each meridian (1° separation) in the northern hemisphere as calculated from the simulated Carrington event at 06:10–06:38 UT on 2 Sep 1859. Red dots indicate values exceeding the largest known measured value (2700 nT/min) at the Lovö observatory in Sweden on 13 Jul 1982 and also marked as a dashed line. Lower panel: geomagnetic latitude of the site of maximum |dH/dt| at each longitude. Red colour is used similarly to the upper panel.
Current usage metrics show cumulative count of Article Views (full-text article views including HTML views, PDF and ePub downloads, according to the available data) and Abstracts Views on Vision4Press platform.
Data correspond to usage on the plateform after 2015. The current usage metrics is available 48-96 hours after online publication and is updated daily on week days.
Initial download of the metrics may take a while.