Figure 8
Download original image
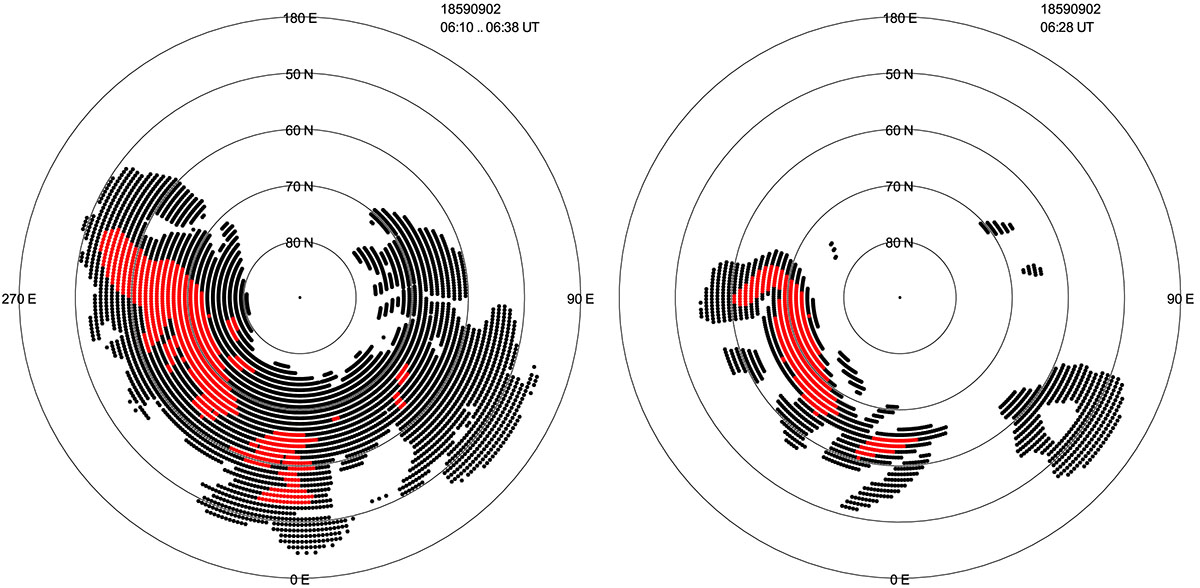
Left: Polar view of “hot spots” where |dH/dt| exceeded 2700 nT/min (red) or 1350 nT/min (black) at least once at 06:10–06:38 UT during the simulated Carrington storm on 2 Sep 1859. Right: Snapshot at 06:28 UT, when the number of points with |dH/dt| > 2700 nT/min reached its maximum of the whole event. Geomagnetic latitudes are used.
Current usage metrics show cumulative count of Article Views (full-text article views including HTML views, PDF and ePub downloads, according to the available data) and Abstracts Views on Vision4Press platform.
Data correspond to usage on the plateform after 2015. The current usage metrics is available 48-96 hours after online publication and is updated daily on week days.
Initial download of the metrics may take a while.