Open Access
Figure 11
Download original image
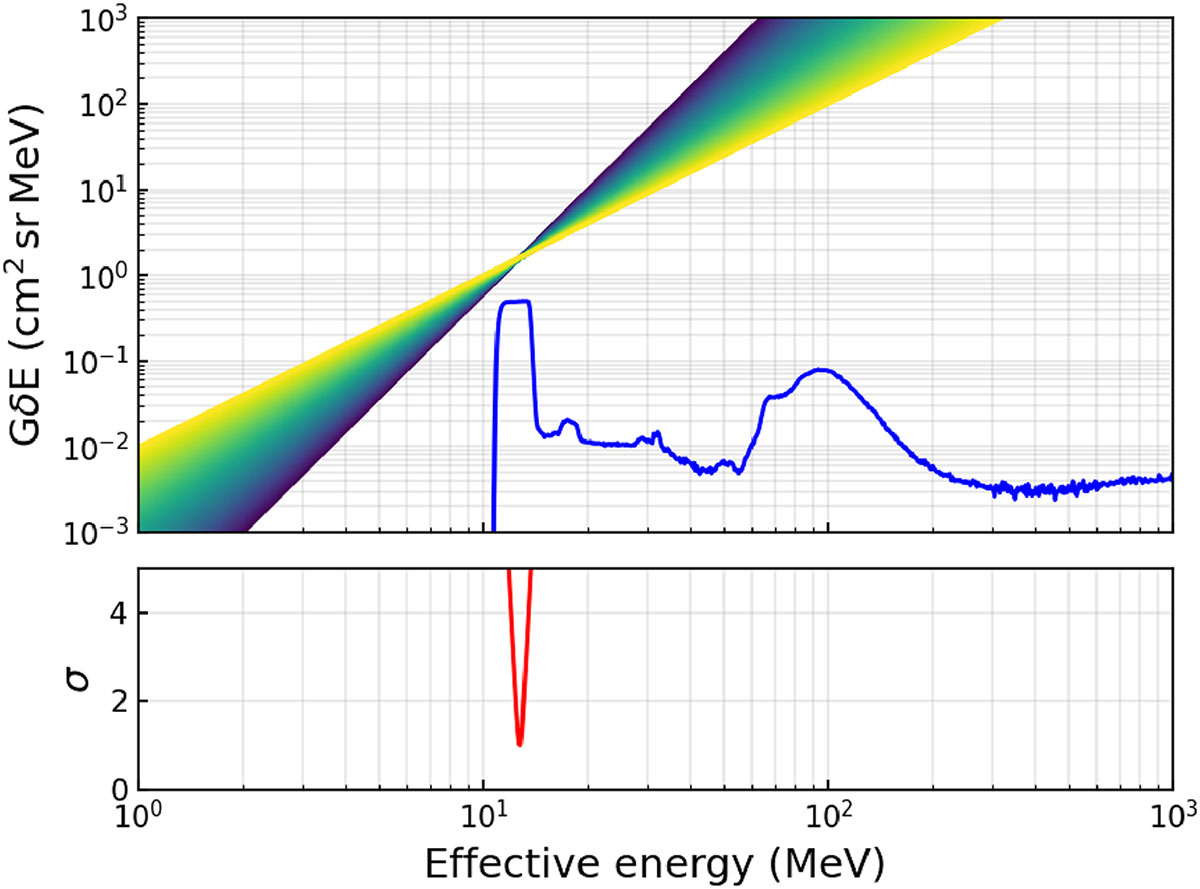
Bow-tie analysis using model spectra with a range of indices α from −4 to −2 and response function in cm2 sr (blue line) of the P8 proton channel. The lower panel shows the statistical measure of the bow-tie spreading in standard deviation units normalized to the deviation of GδE at Eeff for the channel.
Current usage metrics show cumulative count of Article Views (full-text article views including HTML views, PDF and ePub downloads, according to the available data) and Abstracts Views on Vision4Press platform.
Data correspond to usage on the plateform after 2015. The current usage metrics is available 48-96 hours after online publication and is updated daily on week days.
Initial download of the metrics may take a while.