Figure 1
Download original image
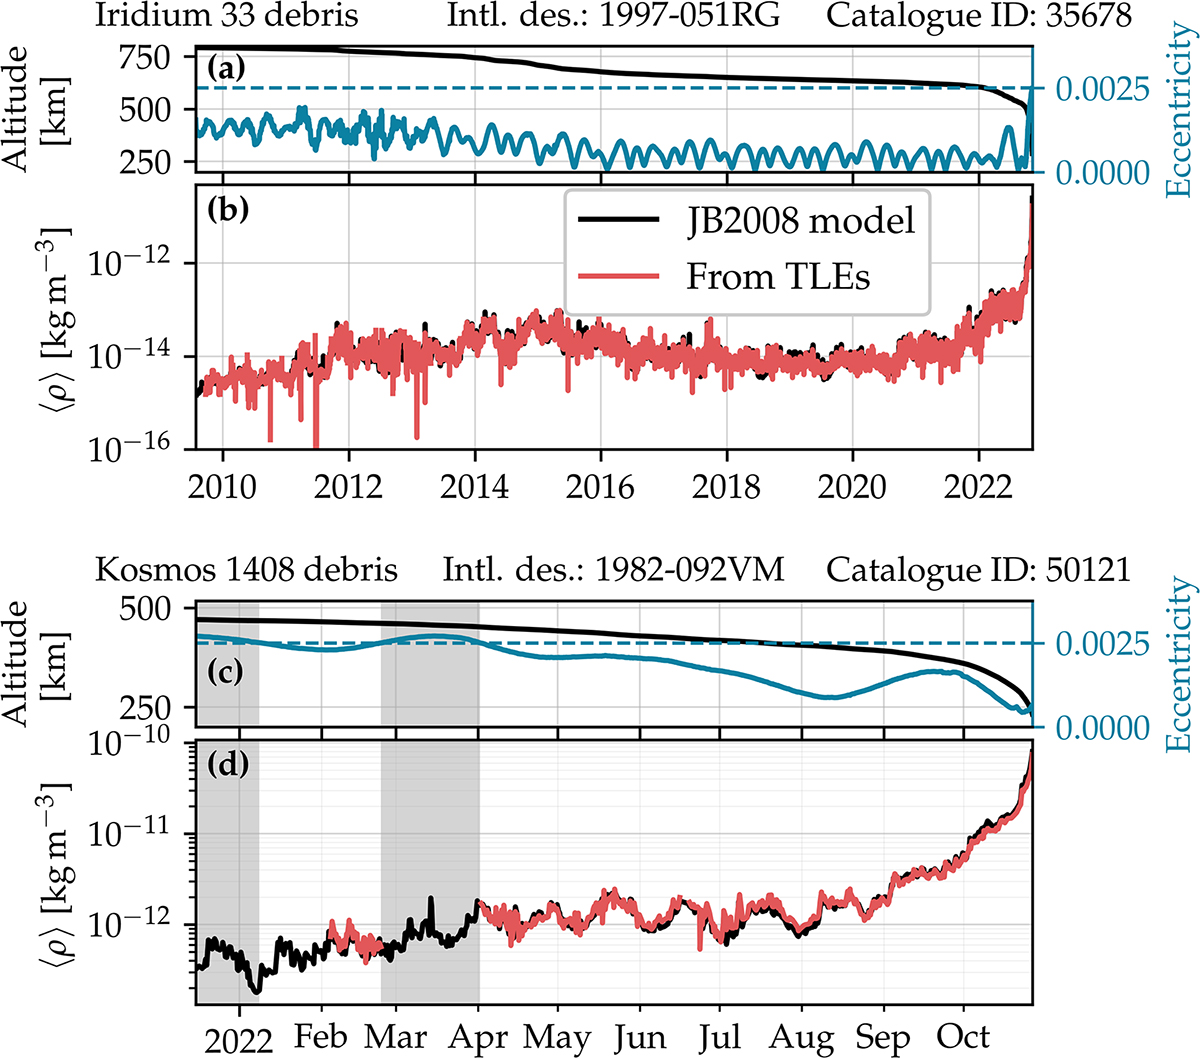
Examples of derived mass densities for two debris objects. (a and c) Average orbital altitude in black and orbital eccentricity in blue on the right y-axis. The dashed line shows eccentricity 0.0025, which is later used as an upper limit for the analysis. (b and d) Orbit-averaged mass densities from the JB2008 model in black and derived from TLEs. Gray shading indicates times when the eccentricity is above the chosen limit. The panel titles show object name, international designator (or COSPAR ID), and the catalogue number assigned to the object.
Current usage metrics show cumulative count of Article Views (full-text article views including HTML views, PDF and ePub downloads, according to the available data) and Abstracts Views on Vision4Press platform.
Data correspond to usage on the plateform after 2015. The current usage metrics is available 48-96 hours after online publication and is updated daily on week days.
Initial download of the metrics may take a while.