Figure 2
Download original image
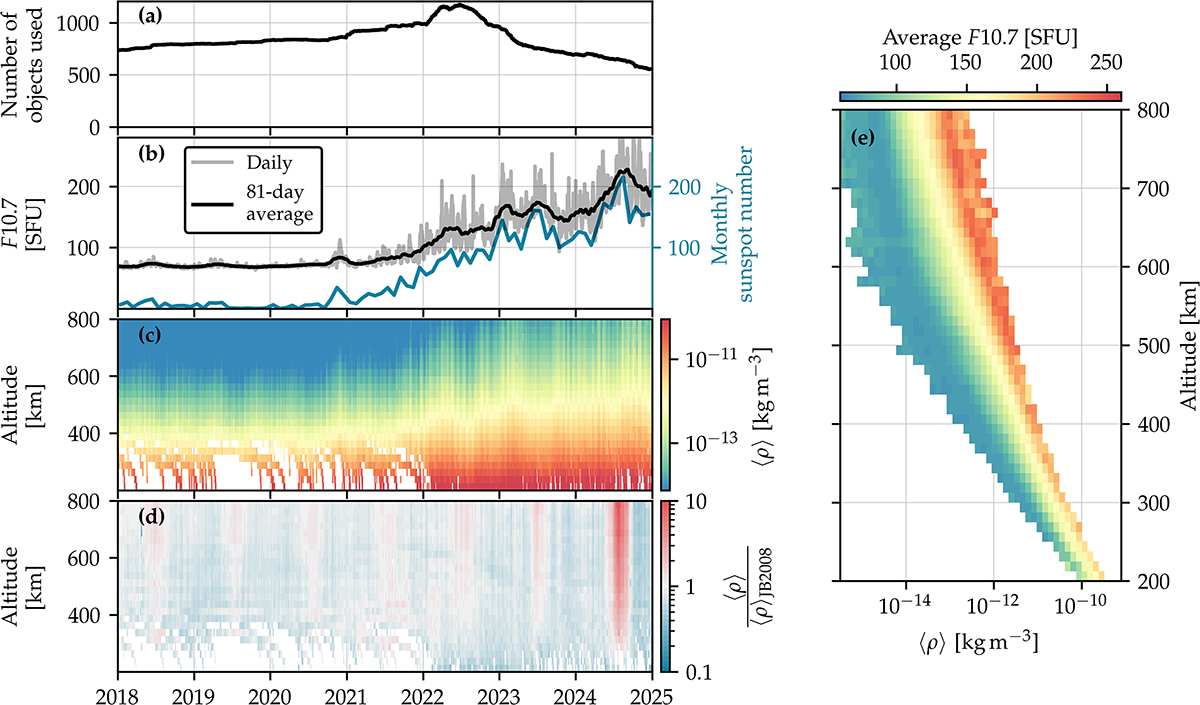
Results from deriving atmospheric density from space debris TLEs. (a) Number of objects used over time. (b) Daily and 81-day average of F10.7 in black and the monthly sunspot number in blue on the right axis. (c) Derived mass density as a function of altitude. (d) Ratio between mass density derived from TLEs and given by the JB2008 model. (e) ⟨ρ⟩ from all TLE pairs as a function of altitude, colored after the average F10.7. Only bins with more than 10 TLE pairs are shown.
Current usage metrics show cumulative count of Article Views (full-text article views including HTML views, PDF and ePub downloads, according to the available data) and Abstracts Views on Vision4Press platform.
Data correspond to usage on the plateform after 2015. The current usage metrics is available 48-96 hours after online publication and is updated daily on week days.
Initial download of the metrics may take a while.