Figure 4
Download original image
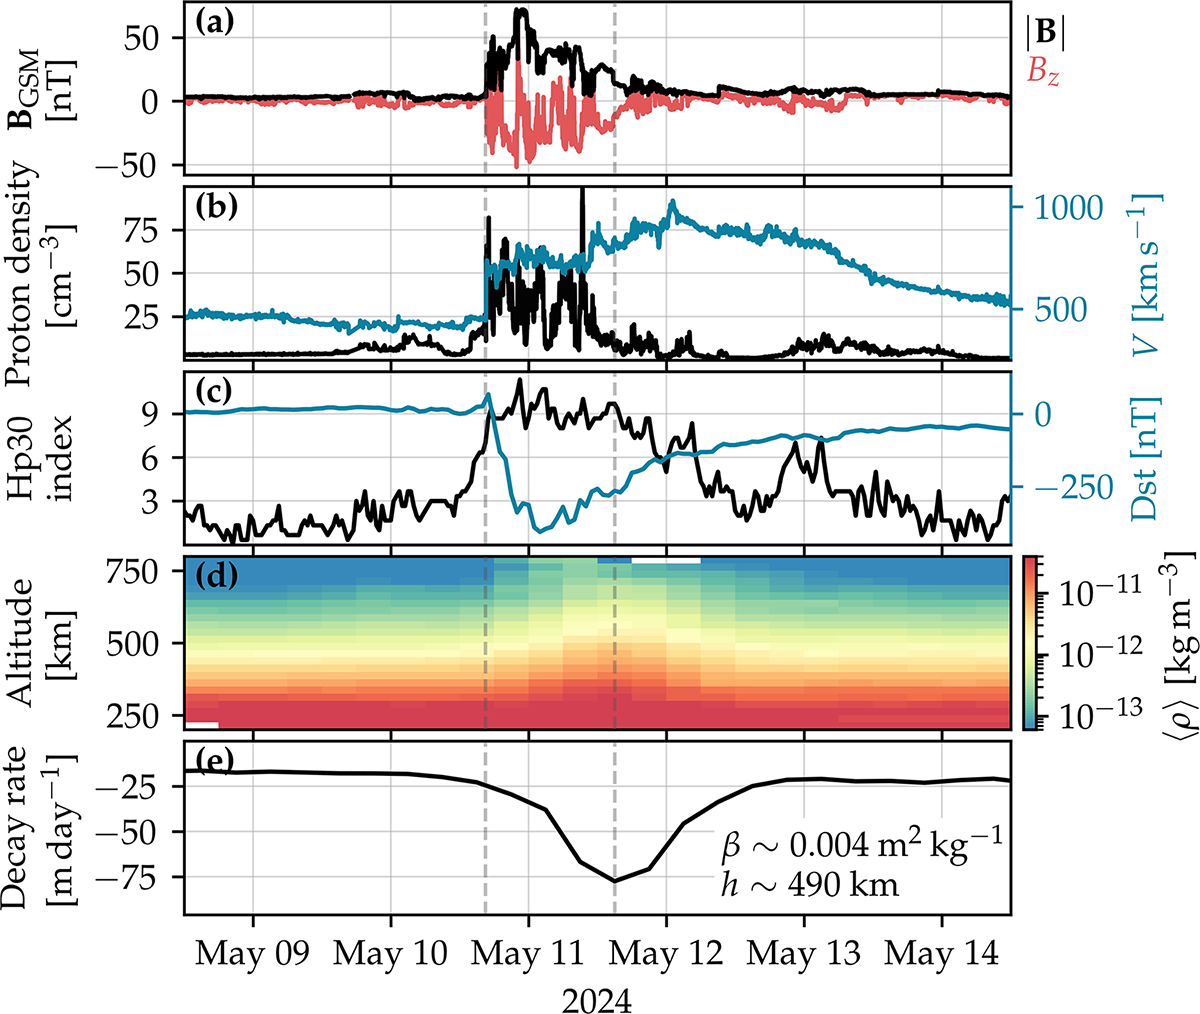
Overview of the G5 geomagnetic storm in May 2024 and solar wind observations from the Wind spacecraft. (a) Solar wind magnetic field strength and z-component in the geocentric solar magnetic coordinate system. (b) Solar wind proton density in black and speed on the right axis in blue. (c) Geomagnetic Hp30 index in black and Dst on the right axis in blue. (d) TLE-derived thermospheric mass density as a function of altitude. (e) Orbital decay of a fictional, GRACE-like satellite. The two vertical dashed lines show the arrival of the first interplanetary shock and the time of maximum satellite drag, respectively.
Current usage metrics show cumulative count of Article Views (full-text article views including HTML views, PDF and ePub downloads, according to the available data) and Abstracts Views on Vision4Press platform.
Data correspond to usage on the plateform after 2015. The current usage metrics is available 48-96 hours after online publication and is updated daily on week days.
Initial download of the metrics may take a while.