Figure 4.
Download original image
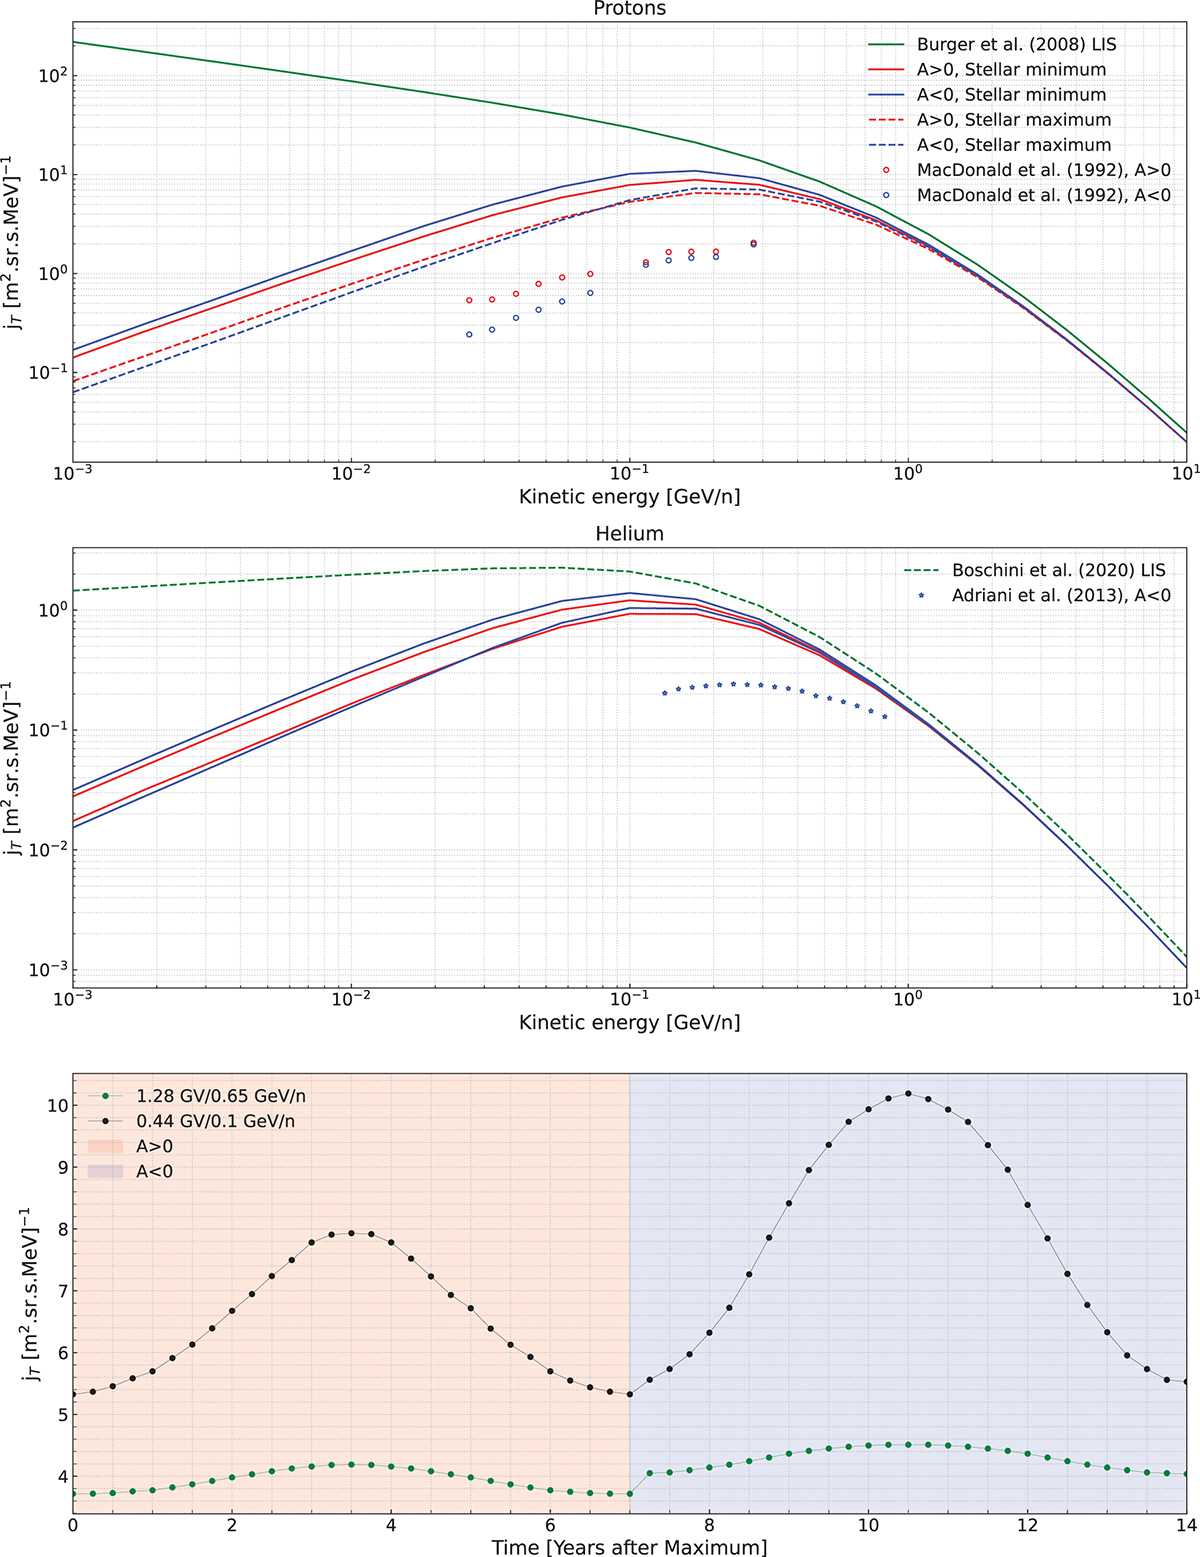
Top panel: GCR proton differential intensities as function of kinetic energy, calculated at 0.0485 au for A > 0 (red lines) and A < 0 (blue lines) magnetic polarity conditions. Solid lines indicate intensities calculated during full stellar minimum, dashed during full stellar maximum. Also shown are the Burger et al. (2008) LIS (green line), and heliospheric observations at Earth reported by McDonald et al. (1992). Middle panels: Same as top panel, but for GCR Helium. Green dashed line denotes the Boschini et al. (2020) LIS employed here, while stars indicate A < 0 PAMELA observations reported by Adriani et al. (2013). Bottom panel: 1.28 and 0.44 GV GCR proton intensities (green and black lines, respectively) calculated at 0.05 au as function of time after full stellar maximum.
Current usage metrics show cumulative count of Article Views (full-text article views including HTML views, PDF and ePub downloads, according to the available data) and Abstracts Views on Vision4Press platform.
Data correspond to usage on the plateform after 2015. The current usage metrics is available 48-96 hours after online publication and is updated daily on week days.
Initial download of the metrics may take a while.