


Figure 3.
Download original image
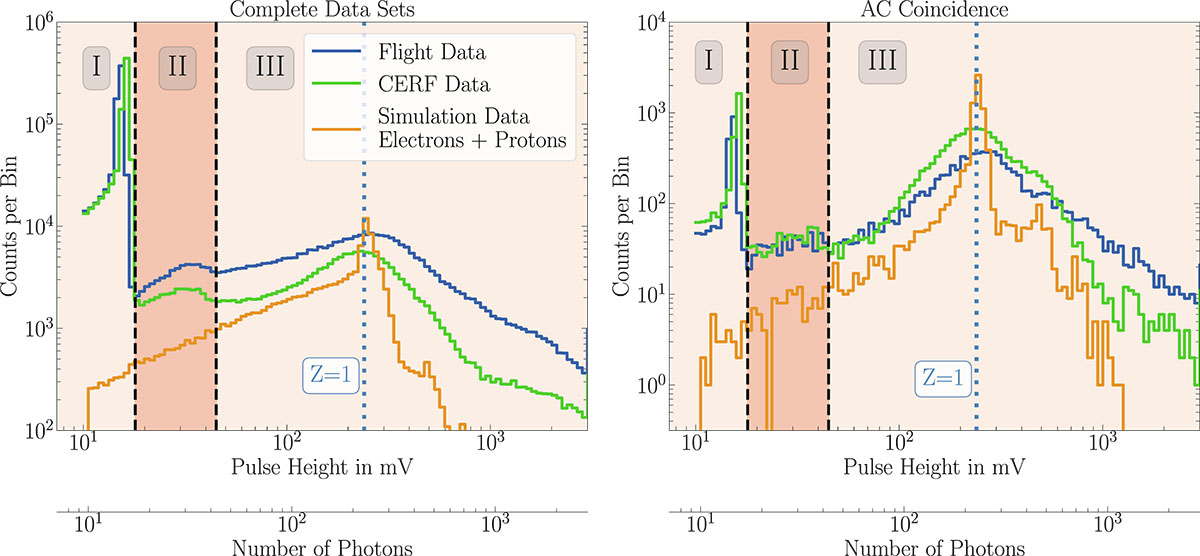
Pulse height histograms for Cherenkov Stage B for the flight data (blue), the CERF data (green), and the combined simulation data of electrons and protons (orange). The abscissae show the pulse heights in the unit of mV for the flight and CERF data and the number of photons for the simulation data. For better comparison of the different data sets, the Z = 1 peak of the simulation data was aligned with the corresponding peak in the flight data, which is marked with the blue dotted line. Three regions are highlighted, with boundaries marked by black dashed lines at 18 mV and 45 mV, corresponding to 17 photons and 42 photons for the simulation data, respectively. For the ordinates, the registered counts per bin are shown (note the different axis ranges). The left panel shows the complete data sets, while the right panel uses the AC coincidence. In this coincidence, only particles that deposited energy in both SSD Stages A and C are considered, which implies that the particles must have passed through Cherenkov Stage B.
Current usage metrics show cumulative count of Article Views (full-text article views including HTML views, PDF and ePub downloads, according to the available data) and Abstracts Views on Vision4Press platform.
Data correspond to usage on the plateform after 2015. The current usage metrics is available 48-96 hours after online publication and is updated daily on week days.
Initial download of the metrics may take a while.