


Figure 5.
Download original image
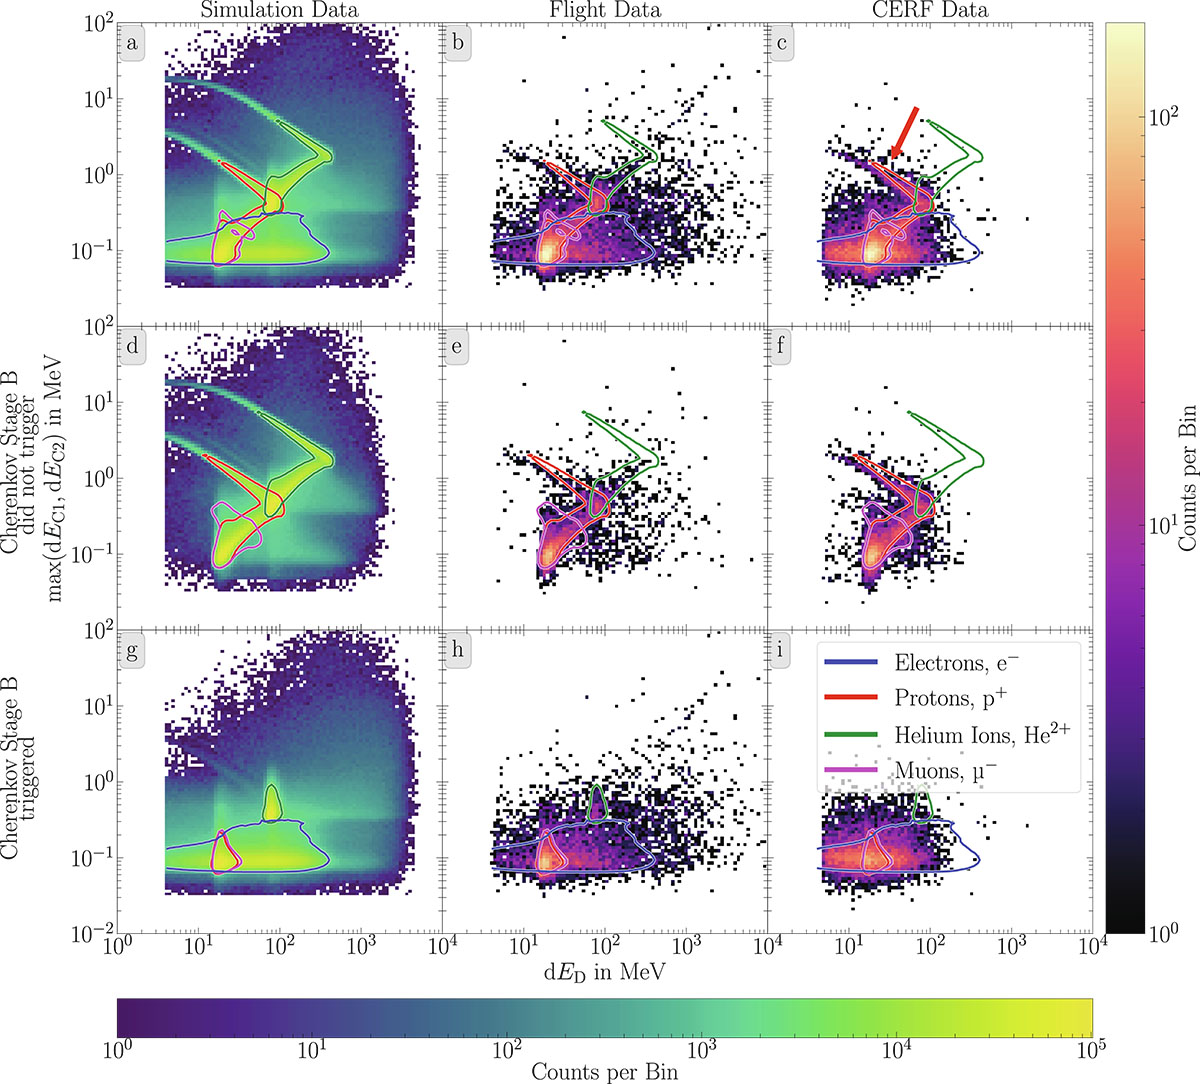
dE/dx − dE/dx plots for the simulation, flight, and CERF data (left, center and right column, respectively). Note the different color schemes for the simulation data and the actual measurements. Each panel shows a two-dimensional histogram of particles in ACD coincidence, which means that the visualized particles deposited energy in SSD Stages A and C as well as Scintillator Stage D. Therefore, the particles also passed through Cherenkov Stage B. The abscissae show the energy loss in Scintillator Stage D while the ordinates show the energy loss in SSD Stage C. For SSD Stage C, the maximum value of the signals measured by the two readout segments of the SSD is taken, as a particle can only deposit energy in one readout segment while passing through SSD Stage C. In the first row, no further restrictions except the ACD coincidence are applied to the data sets. The second row shows only particles that did not trigger Cherenkov Stage B (Region I in Fig. 3). Particles that triggered Cherenkov Stage B are shown in the third row (Region III in Fig. 3). In each panel, contour lines are shown to indicate where different particle types appear within the histograms (compare Fig. 4).
Current usage metrics show cumulative count of Article Views (full-text article views including HTML views, PDF and ePub downloads, according to the available data) and Abstracts Views on Vision4Press platform.
Data correspond to usage on the plateform after 2015. The current usage metrics is available 48-96 hours after online publication and is updated daily on week days.
Initial download of the metrics may take a while.