| Issue |
J. Space Weather Space Clim.
Volume 4, 2014
|
|
|---|---|---|
| Article Number | A23 | |
| Number of page(s) | 6 | |
| DOI | https://doi.org/10.1051/swsc/2014019 | |
| Published online | 04 August 2014 | |
Research Article
GPS scintillation effects associated with polar cap patches and substorm auroral activity: direct comparison
1
Department of Physics, University of Oslo, PO Box 1048 Blindern, NO-0316
Oslo, Norway
2
Arctic Geophysics, University Centre in Svalbard, N-9171
Longyearbyen, Norway
* Corresponding author: This email address is being protected from spambots. You need JavaScript enabled to view it.
Received:
12
March
2014
Accepted:
2
July
2014
Abstract
We directly compare the relative GPS scintillation levels associated with regions of enhanced plasma irregularities called auroral arcs, polar cap patches, and auroral blobs that frequently occur in the polar ionosphere. On January 13, 2013 from Ny-Ålesund, several polar cap patches were observed to exit the polar cap into the auroral oval, and were then termed auroral blobs. This gave us an unprecedented opportunity to compare the relative scintillation levels associated with these three phenomena. The blobs were associated with the strongest phase scintillation (σϕ), followed by patches and arcs, with σϕ up to 0.6, 0.5, and 0.1 rad, respectively. Our observations indicate that most patches in the nightside polar cap have produced significant scintillations, but not all of them. Since the blobs are formed after patches merged into auroral regions, in space weather predictions of GPS scintillations, it will be important to enable predictions of patches exiting the polar cap.
Key words: Irregularities / Blobs / Aurora / Ionosphere (polar) / Polar cap
© Y. Jin et al., Published by EDP Sciences 2014
 This is an Open Access article distributed under the terms of the Creative Commons Attribution License (http://creativecommons.org/licenses/by/4.0), which permits unrestricted use, distribution, and reproduction in any medium, provided the original work is properly cited.
1. Introduction
It is well known that ionospheric irregularities can affect the propagation of trans-ionospheric radio wave signals by causing fluctuations in its amplitude and phase, called scintillations (Yeh & Liu 1982; Kintner et al. 2007). In the case of the Global Positioning System (GPS), scintillations may reduce the accuracy of the pseudo-range and carrier phase measurements. Strong amplitude scintillations may cause the signal power drop below the receiver’s threshold limit and therefore the GPS receiver loses the signal lock, while strong phase scintillations can result in losses of phase lock, which are cycle slips.
There are several categories of ionospheric phenomena that are expected to be associated with plasma instabilities and formations of irregularities at high latitudes. Polar cap patches are islands of high density plasma, with density enhanced by a factor of 2–10 above the background and horizontal dimensions ranging from 100 to 1000 km (Tsunoda 1988). They are called patches when observed in the polar cap and blobs after they exit the polar cap (Basu et al. 1990; Crowley et al. 2000). There are three types of blobs: (1) boundary blobs, (2) subauroral blobs, (3) auroral blobs (Crowley et al. 2000). In this study, however, auroral blobs are referred to the structures corresponding to the patches merging into the night-side auroral zone. It is well known that both polar cap patches and auroral particle precipitations can develop small scale ionospheric irregularities (Tsunoda 1988; Basu et al. 1990); these irregularities can scatter radio signals and give rise to scintillations. In recent years, more GPS scintillation monitors have been deployed at high latitudes, and several statistical and case studies of high latitude GPS scintillations have been conducted (De Franceschi et al. 2008; Spogli et al. 2009; Li et al. 2010; Alfonsi et al. 2011; Prikryl et al. 2010, 2011, 2013; Moen et al. 2013; Jiao et al. 2013). Mitchell et al. (2005) found phase and amplitude scintillations to be colocated with strong gradients in the Total Electron Content (TEC) at the edges of the high electron density streams. Furthermore, scintillation climatology studies by Spogli et al. (2009) demonstrated enhanced scintillation levels around magnetic midnight, which were consistent with the Magnetic Local Time (MLT) distribution of polar cap patches at night (Moen et al. 2007). By comparing the GPS data with radio instruments, Prikryl et al. (2010) claimed that the polar cap patches are the main contributors to scintillation-causing irregularities in the polar cap. In the case of auroral arcs, strong correlations between GPS phase scintillations and optical auroral emissions were found (Kinrade et al. 2013). However, no direct comparisons of scintillation effects associated with different ionospheric phenomena were studied: the question of which class of phenomena has the strongest impacts on GPS signals remains unanswered. In this study, we compare the scintillation effects of different phenomena and try to answer which is the worst case. This is the first direct comparison of scintillation effects caused by polar cap patches, auroral arcs, and auroral blobs. Results imply that among these phenomena, the auroral blobs are associated with the strongest GPS phase scintillations.
2. Observations
The all-sky imaging photometer (ASIP, sometimes called all-sky imager) and GPS scintillation monitor are used in this study, both of which are located at Ny-Ålesund, Svalbard (78.9° N, 11.9° E; 75.8° N corrected geomagnetic latitude, 24 MLT = 20:50 UT). This ASIP is hyper sensitive with an accuracy of several Rayleighs and is very suitable to track the movement of polar cap patches. The observed emission intensity of the ASIP has not yet been calibrated into the Rayleigh scale (absolute calibration); hence the emissions are presented in the units of counts (this is adequate for this study). The GPS scintillation monitor is the standard GPS Ionospheric Scintillation/TEC Monitor (GISTM), model GSV4004 (Van Dierendonck et al. 1993). The amplitude and phase scintillation indices are calculated and recorded automatically by the GISTM. The amplitude scintillation index (S4) is defined as the standard deviation of the received signal power, based on the 50-Hz sampling rate, normalized to the average signal power over one minute periods. The phase scintillation index (σϕ) is defined as the standard deviation of the carrier phase that has been detrended by a high-pass sixth-order Butterworth filter. σϕ that were computed over one minute intervals are used in this study. Notable amplitude scintillations seldom occur in the high latitudes (Spogli et al. 2009; Li et al. 2010; Prikryl et al. 2010; Moen et al. 2013), and in the time period of our interest, the amplitude scintillation indices were mostly at the noise level (S4 is below or around 0.05), thus we focus on the phase scintillation in this study.
Figure 1a shows a keogram of the 630.0 nm emissions scanned from the ASIP along the geomagnetic North-South cross section. A poleward expansion of auroral arcs due to a substorm covered most of the camera Field of View (FOV) between 16:30 UT and 17:30 UT. From around 18:30 UT to 23:00 UT, we find a sequence of six inverted integral signs in the keogram (denoted by A–F in Fig. 1a), which is a feature of polar cap patches travelling across the FOV from north to south (Lorentzen et al. 2004; Moen et al. 2007). From 20:00 UT to 22:00 UT, the auroral boundary moved poleward, stopped and retreated equatorward several times, which is an auroral signature of transient tail reconnection followed by boundary relaxation (Lorentzen et al. 2004; Cowley & Lockwood 1992; Moen et al. 2007). Several polar cap patches crossed the open/closed magnetic field line boundary and exited into the nightside auroral oval, where they changed their status to auroral blobs (Crowley et al. 2000). Figure 1b shows the phase scintillation indices (in radians) recorded by the GPS scintillation monitor, where measurements from different satellites are denoted by the Pseudo Random Noise (PRN) code which is color coded. The scintillation level was very low between 15:00 UT and 18:00 UT, i.e., including the time period when there were prominent substorm auroral arcs (indicated by the red colored regions in Fig. 1a). Most of the isolated scintillation events (σϕ ~ 0.2–0.3 rad) were from satellites colocated with polar cap patches that passed through the north part of the ASIP, while σϕ from other satellites stayed at a low level. In this study, we concentrate on polar cap patches that passed through the entire ASIP FOV from north to south, i.e., patches A–F as denoted in Figure 1a. Patch A was seen at around 19:00 UT and was found unstructured: very weak or no scintillation occurred, σϕ is mostly less than 0.1 rad but clearly above the noise level (σϕ ~ 0.05 rad). Two strong scintillation events (σϕ ~ 0.5 rad), which were associated with polar cap patches C and F, were observed around 20:15 UT (shaded region I) and 22:50 UT (shaded region III), respectively. Less strong scintillations were also observed for patches B and E with σϕ up to 0.2 rad and 0.4 rad. From Figure 1, it can be found that the strongest scintillation (σϕ ~ 0.6 rad) occurred at 21:37 UT after patch D merged into the auroral region (shaded region II). This indicates that the strongest scintillation was associated with auroral blobs. Figure 1c shows the mean phase scintillation index for all the GPS satellites that is averaged over 10 min. The average value can be used to denote the space weather condition at Ny-Ålesund: larger values indicate that more GPS satellites were affected and therefore positioning errors were larger. Apart from patch A at around 19:00 UT, the scintillation level intensified when polar cap patches came into the satellites ray paths. This implies a significant influence of polar cap patches on space weather conditions.
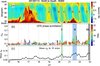 |
Fig. 1. (a) The keogram scanned along the North-South cross section as a function of scan angle from 15° North to 15° South from the 630.0 nm channel of the all-sky imaging photometer (ASIP) at Ny-Ålesund, January 13, 2013, 15–23 UT. Letters A–F mark six polar cap patches as they moved from north to south across the ASIP. The intensity is color coded according to the log (counts) scale on the right. (b) Phase scintillation indices recorded by the GPS scintillation monitor located at Ny-Ålesund, measurements from different satellites are color coded on the right. (c) Mean phase scintillations for all satellites averaged over 10 min. Shaded regions I–III denote enhanced scintillation events described in the text. |
In Figures 2 and 3, we make more elaborate comparisons of optical emissions and the GPS data. Figures 2a–2d and 3a–3d show 630.0 nm images from the ASIP combined with the locations and σϕ strength for the satellites. The orientation of each image is geographic north to the top, and west to the left. In previous studies, when combining the ASIP and GPS observations, the mapping of GPS satellite locations to the Ionospheric Piercing Points (IPPs, usually assuming the ionosphere to be an infinitesimal thin layer with altitude of 350 km) and mapping optical emission to some height by assuming a fixed altitude were used (Smith et al. 2008; Kinrade et al. 2013; Prikryl et al. 2013). However, as our GPS receiver and ASIP are colocated, we project the azimuthal and elevation angle of GPS satellites onto each image. This method allows for a direct comparison of the optical column integrated emission with the scintillation value corresponding to the trans-ionosphere propagation path of the signal and thus gives a more accurate comparison.
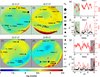 |
Fig. 2. (a–d) A sequence of images from the ASIP at channel 630.0 nm showing the observation of two polar cap patches (patches C and F). The black circles and plus signs indicate the locations of GPS satellites. The size of the circles relates to the σϕ strength showing on the right of the all-sky images, whereas black plus signs mean no scintillation was observed (σϕ < 0.1). (a, b) Patch C came into the FOV and continued to move southward. The scintillation was observed when the patch passed through the line of sight (LOS) of several satellites. (c, d) Patch F entered into the LOS of PRN12 and PRN24, and enhanced phase scintillations were observed. (e) The temporal variation of optical emission at 630.0 nm channel corresponding to the locations of PRN11 in units of log (counts). (f) σϕ (black) and the Slant TEC (red line) from PRN11. σϕ are plotted as black circles when σϕ > = 0.1, otherwise as plus signs. The shaded regions in (e, f) correspond to the time period when patch C passed through the LOS of PRN11. The data gap from 20:50 UT to 21:05 UT in (e, f) is due to loss of lock; PRN11 moved out of the FOV at 22:35 UT, therefore there is no data after this time. (g, h) The same format as (e, f) but for PRN24. The shaded regions show the pass of patch F. |
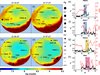 |
Fig. 3. The same format as Figure 2. (a–d) Patch D moved southward and entered into the auroral zone (red colored regions) to become into an auroral blob. Phase scintillations were intensified when patch D passed through the LOS of GPS satellites. (e, f) The shaded regions correspond to the time period when the newly formed blob passed through the LOS of PRN15 and PRN17. There is no data after 22:00 UT in (e) and before 20:54 UT in (f) because PRN15 and PRN17 were out of the FOV at that time. (g, h) The shaded regions correspond to the time periods when patches B and E passed through the LOS of PRN19 and PRN1, respectively. PRN1 was out of the FOV before 20:49 UT and no data was recorded for that time in (h). |
When patch C entered the FOV of the ASIP from the north and got into the line of sight (LOS) of 3 satellites (PRN11, PRN19, PRN22) at 20:13 UT (Fig. 2a), intermediate to strong scintillations were observed. As this patch continued moving southward, scintillations occurred on the signals of other satellites (Fig. 2b). To study the temporal variation of emission intensity, the optical emission intensity is extracted from the ASIP data at the pixels corresponding to the locations of satellites. Figure 2e presents recordings from the 630.0 nm channel. Figure 2f shows σϕ (black) and the Slant TEC (STEC, red line) from PRN11. The shaded regions in Figures 2e and 2f indicate the time period when patch C passed through the ray path of PRN11. It should be noted that the instrumental biases of the GPS satellites and receiver were not removed from the STEC and therefore only relative variations of the STEC were considered in this work. Since the patches moved equatorward quickly, the GPS satellites can be considered as quasi-stationary. The sudden increase and decrease of STEC in the shaded region in Figure 2f indicate the high density patch coming in and moving away from the LOS of PRN11. The STEC increases by about 20 TECU (1 TECU = 1016 el/m2), accompanied by enhanced σϕ up to 0.55 rad. Figure 2e also shows an increase and decrease of 630.0 nm airglow emission, roughly following the variation of STEC. Due to the different altitude distribution of the airglow emission and electron density, the 630.0 nm airglow emission is shifted with respect to the STEC. From Figures 2a and 2b, we find that PRN11 is on the east edge of patch C when the scintillation is intensified, then scintillations occurred all the way during the pass of patch C (Fig. 2f).
Figures 2c and 2d show another scintillation event (shaded region III in Fig. 1) associated with patch F. Before patch F passed through the LOS of PRN12 and PRN24, no scintillations were observed. But when the ray paths of PRN12 and PRN24 intersected with the center of patch F, enhanced scintillations occurred, with σϕ up to 0.2 and 0.5 rad, respectively. Shaded regions in Figures 2g and 2h show the increase of airglow emission and STEC, which indicate the pass of patch F. The accompanying high phase scintillations indicate the strong effects of patch F on GPS signals. Note that scintillations occurred near the center and trailing edge of patch F at the location of PRN24. However, the scintillations only occurred on the leading and trailing edges on the east part of patch F as observed by PRN1 and PRN17 (Fig. 2c). The scintillations were seen on the edges, but not in the central region, which has implications for and put constraints upon the irregularities formation processes.
Figures 3a–3d show patch D moving equatorward and entering into the expanding auroral oval (red colored regions in the south FOV) to transform into an auroral blob. As patch D moved southward and passed through ray paths of GPS satellites, scintillations were found on PRN18, PRN28, and PRN24 successively. Note that the ray paths of PRN15 and PRN17 passed through the auroral zone in Figures 3a and 3b, but this pure substorm aurora (without patches) only produced very low level phase scintillations (σϕ ~ 0.1–0.15 rad). Patch D started to merge into the auroral zone at around 21:16 UT and the newly formed auroral blob passed through the LOS of PRN15 and PRN17 at around 21:18 UT. Figures 3e and 3f show that at 21:18 UT, σϕ from both satellites were enhanced (σϕ ~ 0.2–0.3 rad). Later on, more high density plasma merged into the auroral zone and σϕ increased to 0.4 rad at 21:30 UT (PRN15, Fig. 3c). The enhanced scintillation lasted for about 25 min and reached their highest level (σϕ ~ 0.6 rad) at 21:37 UT (PRN17, Fig. 3d). The highest scintillation associated with this patch before it merged into the auroral oval was found to be 0.4 rad (PRN18, Fig. 3a). Even higher scintillations after entering the auroral oval suggest that the auroral blobs were more effective sources to produce scintillations. The aurora retreated equatorward and got out of the LOS of PRN15 and PRN17 at around 21:42 UT. Figures 3e and 3f show the scintillations started to diminish at this time.
The results for two remaining patches are shown in Figures 3g and 3h. In Figure 3g, the shaded region shows scintillation effects of patch B on PRN19. Patch C followed patch B very closely, and the immediate STEC peak after the shaded region in Figure 3g indicates the pass of patch C. Enhanced scintillations (σϕ ~ 0.2 rad) were mainly found on the trailing edges of patch B (decrease in STEC). The effect of patch E on PNR1 is shown in Figure 3h: scintillations occurred all across patch E, but most of the strong scintillations (σϕ up to 0.45 rad) were found on the leading edges.
3. Discussion
The phase scintillation of the GPS signals is caused by small scale electron density irregularities from hundreds of meters to a few kilometers in the ionosphere (Hunsucker & Hargreaves 2002; Spogli et al. 2009). The polar cap patches represent the largest scale structure in the high latitude ionosphere (Tsunoda 1988). During their convection in the polar cap, the Gradient Drift Instability (GDI) acts on them and develops small scale irregularities on the trailing edge. On the leading edge, the plasma density gradient sets up polarization fields that stabilize the plasma structure (Keskinen & Ossakow 1983), as observed by Moen et al. (2012). However, although the GDI occurs initially on the trailing edge, the nonlinear development could penetrate through the entire patch (Gondarenko & Guzdar 2004). The plasma can also be structured throughout a patch upon its formation, formed either by a magnetic reconnection event which of itself introduces sheer driven instabilities (Carlson et al. 2008), or by soft-electron precipitation (Kelley et al. 1982). In addition, the patches may follow a nonuniform flow pattern which can be highly dynamic and pulsed. They can undergo substantial rotations in the central polar cap, so that the leading edge could become the trailing edge (Oksavik et al. 2010). Therefore, the patches could become structured on the trailing and leading edges or fully structured to have irregularities that scintillate the GPS signals after they pass through the polar cap. In Figure 2, scintillations were found near some of the edges and the center of both patches. The scintillations at the center indicate internal structuring. However, in Figures 3a and 3b, scintillations were found at the leading edge and the east flank of the patch, but not in the center (where PRN22 was located), although the plasma density was the highest there (not shown in the figures). This indicates a stable plasma condition at the center of this patch. For patches B and E (Figs. 3g and 3h), significant scintillations were also found. Very weak or no scintillations occurred during the pass of patch A at around 19:00 UT, which implies that not all polar cap patches have become structured during their passage across the polar cap (Hosokawa et al. 2009). However, after a long travel in the polar cap, most of the patches have become structured. In this study, six polar cap patches were observed, and five of them were found to be fully or partially structured.
Intense auroral arcs were observed between 16:00 UT and 17:30 UT (Fig. 1a). The auroral arcs filled most of the FOV for about an hour, but only signals from a few satellites were scintillated. This indicates that the auroral arcs alone, which mainly produce irregularities in the E region ionosphere, were not an effective scintillation-producing mechanism in the case presented here. Figures 3a and 3b show again that the pure substorm auroral particle precipitation did not give rise to significant phase scintillations. However, there were strong enhancements in σϕ after the patch entered the auroral zone and intersected with the satellite ray paths. The large scale patches were convected out of the polar cap and then likely distorted into longitudinally elongated blobs (Anderson et al. 1996; Crowley et al. 2000). Several peaks of STEC in shaded regions of Figures 3e and 3f indicate the deformation of the patch and the multi-scale structure in the blob. Within the auroral zone there is a lot of free energy to drive various instabilities. Obviously, there may be velocity shears associated with auroral arcs that can rapidly develop small scale irregularities on large scale structures (auroral blobs) by the Kelvin-Helmholtz type, velocity shear Instability (KHI) (Kersley et al. 1988; Keskinen et al. 1988; Carlson et al. 2008; Carlson 2012). The auroral precipitation interacting with the polar cap patches may give rise to plasma gradients on which the GDI can operate as has been documented in the dayside cusp (Moen et al. 2012). Apparently from our observations, the auroral blobs can stand out as the most violent scintillation region from the GPS user’s point of view.
4. Summary and concluding remarks
The collocation of the GPS scintillation receiver and a hyper sensitive ASIP allowed us to project GPS satellites onto the ASIP without making any assumption of the optical emission height as well as the satellite piercing point in a single layered ionosphere model. By using this new method, the first direct comparison of scintillation levels associated with three classes of high latitude ionospheric phenomena (polar cap patches, auroral arcs, and auroral blobs) were made. The study shows that auroral blobs are associated with the most intense scintillation. The second intense scintillation effects are associated with polar cap patches. In our example, only one of the six observed patches did not affect the GPS signals significantly. Although the auroral arcs appear as the most impressive sky phenomenon, their scintillation impact is considerably weaker than for polar cap patches that are not visible to the human eyes. To conclude, the worst situation in the European Arctic sector can occur when polar cap patches are further structured by the substorm auroral arc dynamics, i.e., signal interferences with the auroral blob phenomenon around magnetic midnight. This can explain the scintillation climatology study by Spogli et al. (2009) who attributed the scintillation peak around magnetic midnight to the statistical distribution of polar cap patches exiting the polar cap around magnetic midnight (Moen et al. 2007). However, there is a need to carry out a statistical study to see if this is always true. The blobs are the least understood phenomenon (Crowley et al. 2000) and there is a need to investigate the blob formation by in-situ measurements to assess the instability modes and growth rates involved. This is the primary target for the Norwegian ICI-4 rocket to be launched in 2014.
Acknowledgments
The authors thank the Norwegian Polar Research Institute at Ny-Ålesund for assisting us with the GPS receiver and the optical observations in Ny-Ålesund, as well as Dr. Bjørn Lybekk and Mr. Espen Trondsen for the instrument operations, and Dr. Charles Carrano for providing the GPS software. The research has received financial support from the Research Council of Norway grant 208006/F50. This research is a part of the 4DSpace initiative at the University of Oslo.
Added in August 20th, 2014: The editor thanks Herbert C. Carlson and Matthias Foerster for their assistance in evaluating this paper.
References
- Alfonsi, L., L. Spogli, G. De Franceschi, V. Romano, M. Aquino, A. Dodson, and C.N. Mitchell, Bipolar climatology of GPS ionospheric scintillation at solar minimum, Radio Sci., 46, RS0D05, DOI: 10.1029/2010RS004571, 2011. [CrossRef] [Google Scholar]
- Anderson, D.N., D.T. Decker, and C.E. Valladares, Modeling boundary blobs using time varying convection, Geophys. Res. Lett., 23, 579–582, DOI: 10.1029/96GL00371, 1996. [CrossRef] [Google Scholar]
- Basu, S., S. Basu, E. Mac Kenzie, W.R. Coley, J.R. Sharber, and W.R. Hoegy, Plasma structuring by the gradient drift instability at high latitudes and comparison with velocity shear driven processes, J. Geophys. Res., 95 (A6), 7799–7818, DOI: 10.1029/JA095iA06p07799, 1990. [Google Scholar]
- Carlson, H.C., K. Oksavik, and J. Moen, On a new process for cusp irregularity production, Ann. Geophys., 26, 2871–2885, DOI: 10.5194/angeo-26-2871-2008, 2008. [Google Scholar]
- Carlson, H.C., Sharpening our thinking about polar cap ionospheric patch morphology, research, and mitigation techniques, Radio Sci., 47, RS0L21, DOI: 10.1029/2011RS004946, 2012. [CrossRef] [Google Scholar]
- Cowley, S.W.H., and M. Lockwood, Excitation and decay of solar wind-driven flows in the magnetosphere-ionosphere system, Ann. Geophys., 10, 103–115, 1992. [Google Scholar]
- Crowley, G., A.J. Ridley, D. Deinst, S. Wing, D.J. Knipp, B.A. Emery, F. Foster, R. Heelis, M. Hairston, and B.W. Reinisch, Transformation of high-latitude ionospheric F region patches into blobs during the March 21, 1990, storm, J. Geophys. Res., 105, 5215–5230, DOI: 10.1029/1999JA900357, 2000. [Google Scholar]
- De Franceschi, G., L. Alfonsi, V. Romano, M. Aquino, A. Dodson, C.N. Mitchell, P. Spencer, and A.W. Wernik, Dynamics of high latitude patches and associated small-scale irregularities during the October and November 2003 storms, J. Atmos. Sol. Terr. Phys., 70, 879–888, DOI: 10.1016/j.jastp.2007.05.018, 2008. [CrossRef] [Google Scholar]
- Gondarenko, N.A., and P.N. Guzdar, Plasma patch structuring by the nonlinear evolution of the gradient drift instability in the high-latitude ionosphere, J. Geophys. Res., 109, A09301, DOI: 10.1029/2004JA010504, 2004. [Google Scholar]
- Hosokawa, K., K. Shiokawa, Y. Otsuka, T. Ogawa, J.-P. St.-Maurice, G.J. Sofko, and D.A. Andre, Relationship between polar cap patches and field-aligned irregularities as observed with an all-sky airglow imager at Resolute Bay and the PolarDARN radar at Rankin Inlet, J. Geophys. Res., 114, A03306, DOI: 10.1029/2008JA013707, 2009. [Google Scholar]
- Hunsucker, R.D., and J.K. Hargreaves, The High-Latitude Ionosphere and Its Effects on Radio Propagation, Cambridge University Press, Cambridge, UK, 2002. [CrossRef] [Google Scholar]
- Jiao, Y., Y.T. Morton, S. Taylor, and W. Pelgrum, Characterization of high-latitude ionospheric scintillation of GPS signals, Radio Sci., 48, 698–708, DOI: 10.1002/2013RS005259, 2013. [CrossRef] [Google Scholar]
- Kelley, M.C., J.F. Vickrey, C.W. Carlson, and R. Torbert, On the origin and spatial extent of high-latitude F region irregularities, J. Geophys. Res., 87 (A6), 4469–4475, 1982. [Google Scholar]
- Kersley, L., S.E. Pryse, and N.S. Wheadon, Small scale irregularities associated with a high latitude electron density gradient: scintillation and EISCAT observations, J. Atmos. Sol. Terr. Phys., 50 (6), 557–563, DOI: 10.1016/0021-9169(88)90114-6, 1988. [Google Scholar]
- Keskinen, M.J., and S.L. Ossakow, Theories of high-latitude ionospheric irregularities: A review, Radio Sci., 18 (6), 1077–1091, DOI: 10.1029/RS018i006p01077, 1983. [CrossRef] [Google Scholar]
- Keskinen, M.J., H.G. Mitchell, J.A. Fedder, P. Satyanarayana, S.T. Zalesak, and J.D. Huba, Nonlinear evolution of the Kelvin-Helmholtz instability in the high-latitude ionosphere, J. Geophys. Res., 93 (A1), 137–152, doi: 10.1029/JA093iA01p00137, 1988. [Google Scholar]
- Kinrade, J., C.N. Mitchell, N.D. Smith, Y. Ebihara, A.T. Weatherwax, and G.S. Bust, GPS phase scintillation associated with optical auroral emissions: first statistical results from the geographic South Pole, J. Geophys. Res., 118, 2490–2502, DOI: 10.1002/jgra.50214, 2013. [CrossRef] [Google Scholar]
- Kintner, P.M., B.M. Ledvina, and E.R. de Paula, GPS and ionospheric scintillations, Space Weather, 5, S09003, DOI: 10.1029/2006SW000260, 2007. [CrossRef] [Google Scholar]
- Li, G., B. Ning, Z. Ren, and L. Hu, Statistics of GPS ionospheric scintillation and irregularities over polar regions at solar minimum, GPS Solutions, 14, 331–341, DOIDOI: 10.1007/s10291-009-0156-x, 2010. [CrossRef] [Google Scholar]
- Lorentzen, D.A., N. Shumilov, and J. Moen, Drifting airglow patches in relation to tail reconnection, Geophys. Res. Lett., 31, L02806, DOI: 10.1029/2003GL017785, 2004. [Google Scholar]
- Mitchell, C.N., L. Alfonsi, G. Defranceschi, M. Lester, V. Romano, and A.W. Wernik, GPS TEC and scintillation measurements from the polar ionosphere during the October 2003 storm, Geophys. Res. Lett., 32, L12S03, DOI: 10.1029/2004GL021644, 2005. [Google Scholar]
- Moen, J., N. Gulbrandsen, D.A. Lorentzen, and H.C. Carlson, On the MLT distribution of F region polar cap patches at night, Geophys. Res. Lett., 34, L14113, DOI: 10.1029/2007GL029632, 2007. [Google Scholar]
- Moen, J.I., K. Oksavik, T. Abe, M. Lester, Y. Saito, T.A. Bekkeng, and K.S. Jacobsen, First in-situ measurements of HF radar echoing targets, Geophys. Res. Lett., 39, L07104, DOI: 10.1029/2012GL051407, 2012. [Google Scholar]
- Moen, J., K. Oksavik, L. Alfonsi, Y. Daabakk, V. Romano, and L. Spogli, Space weather challenges of the polar cap ionosphere, J. Space Weather Space Clim., 3, A02, DOI: 10.1051/swsc/2013025, 2013. [Google Scholar]
- Oksavik, K., V.L. Barth, J. Moen, and M. Lester, On the entry and transit of high-density plasma across the polar cap, J. Geophys. Res., 115, A12308, DOI: 10.1029/2010JA015817, 2010. [Google Scholar]
- Prikryl, P., P.T. Jayachandran, S.C. Mushini, D. Pokhotelov, J.W. MacDougall, E. Donovan, E. Spanswick, and J.-P. St.-Maurice, GPS TEC, scintillation and cycle slips observed at high latitudes during solar minimum, Ann. Geophys., 28 (6), 1307–1316, DOI: 10.5194/angeo-28-1307-2010, 2010. [Google Scholar]
- Prikryl, P., P.T. Jayachandran, S.C. Mushini, and R. Chadwick, Climatology of GPS phase scintillation and HF radar backscatter for the high-latitude ionosphere under solar minimum conditions, Ann. Geophys., 29, 377–392, DOI: 10.5194/angeo-29-377-2011, 2011. [Google Scholar]
- Prikryl, P., Y. Zhang, Y. Ebihara, R. Ghoddousi-Fard, P.T. Jayachandran, et al., An interhemispheric comparison of GPS phase scintillation with auroral emission observed at the South Pole and from the DMSP satellite, Ann. Geophys., 56, R0216, DOI: 10.4401/ag-6227, 2013. [Google Scholar]
- Smith, A.M., C.N. Mitchell, R.J. Watson, R.W. Meggs, P.M. Kintner, K. Kauristie, and F. Honary, GPS scintillation in the high arctic associated with an auroral arc, Space Weather, 6, S03D01, DOI: 10.1029/2007SW000349, 2008. [CrossRef] [Google Scholar]
- Spogli, L., L. Alfonsi, G. Defranceschi, V. Romano, M.H.O. Aquino, and A. Dodson, Climatology of GPS ionospheric scintillations over high and mid-latitude European regions, Ann. Geophys., 27, 3429–3437, DOI: 10.5194/angeo-27-3429-2009, 2009. [CrossRef] [Google Scholar]
- Tsunoda, R.T., High-latitude F region irregularities: a review and synthesis, Rev. Geophys., 26 (4), 719–760, DOI: 10.1029/RG026i004p00719, 1988. [CrossRef] [Google Scholar]
- Van Dierendonck, A.J., Q. Hua, and J. Klobuchar, Ionospheric scintillation monitoring using commercial single frequency C/A code receivers, Paper presented at proceedings of ION GPS 93, Salt Lake City, UT, 22–24 September, pp. 1333–1342, 1993. [Google Scholar]
- Yeh, K.C., and C.H. Liu, Radio wave scintillations in the ionosphere, Proc. IEEE, 70, 324–360, 1982. [Google Scholar]
Cite this article as: Jin Y, Moen JI & Miloch WJ: GPS scintillation effects associated with polar cap patches and substorm auroral activity: direct comparison. J. Space Weather Space Clim., 2014, 4, A23.
All Figures
|
Fig. 1. (a) The keogram scanned along the North-South cross section as a function of scan angle from 15° North to 15° South from the 630.0 nm channel of the all-sky imaging photometer (ASIP) at Ny-Ålesund, January 13, 2013, 15–23 UT. Letters A–F mark six polar cap patches as they moved from north to south across the ASIP. The intensity is color coded according to the log (counts) scale on the right. (b) Phase scintillation indices recorded by the GPS scintillation monitor located at Ny-Ålesund, measurements from different satellites are color coded on the right. (c) Mean phase scintillations for all satellites averaged over 10 min. Shaded regions I–III denote enhanced scintillation events described in the text. |
| In the text | |
|
Fig. 2. (a–d) A sequence of images from the ASIP at channel 630.0 nm showing the observation of two polar cap patches (patches C and F). The black circles and plus signs indicate the locations of GPS satellites. The size of the circles relates to the σϕ strength showing on the right of the all-sky images, whereas black plus signs mean no scintillation was observed (σϕ < 0.1). (a, b) Patch C came into the FOV and continued to move southward. The scintillation was observed when the patch passed through the line of sight (LOS) of several satellites. (c, d) Patch F entered into the LOS of PRN12 and PRN24, and enhanced phase scintillations were observed. (e) The temporal variation of optical emission at 630.0 nm channel corresponding to the locations of PRN11 in units of log (counts). (f) σϕ (black) and the Slant TEC (red line) from PRN11. σϕ are plotted as black circles when σϕ > = 0.1, otherwise as plus signs. The shaded regions in (e, f) correspond to the time period when patch C passed through the LOS of PRN11. The data gap from 20:50 UT to 21:05 UT in (e, f) is due to loss of lock; PRN11 moved out of the FOV at 22:35 UT, therefore there is no data after this time. (g, h) The same format as (e, f) but for PRN24. The shaded regions show the pass of patch F. |
| In the text | |
|
Fig. 3. The same format as Figure 2. (a–d) Patch D moved southward and entered into the auroral zone (red colored regions) to become into an auroral blob. Phase scintillations were intensified when patch D passed through the LOS of GPS satellites. (e, f) The shaded regions correspond to the time period when the newly formed blob passed through the LOS of PRN15 and PRN17. There is no data after 22:00 UT in (e) and before 20:54 UT in (f) because PRN15 and PRN17 were out of the FOV at that time. (g, h) The shaded regions correspond to the time periods when patches B and E passed through the LOS of PRN19 and PRN1, respectively. PRN1 was out of the FOV before 20:49 UT and no data was recorded for that time in (h). |
| In the text | |
Current usage metrics show cumulative count of Article Views (full-text article views including HTML views, PDF and ePub downloads, according to the available data) and Abstracts Views on Vision4Press platform.
Data correspond to usage on the plateform after 2015. The current usage metrics is available 48-96 hours after online publication and is updated daily on week days.
Initial download of the metrics may take a while.