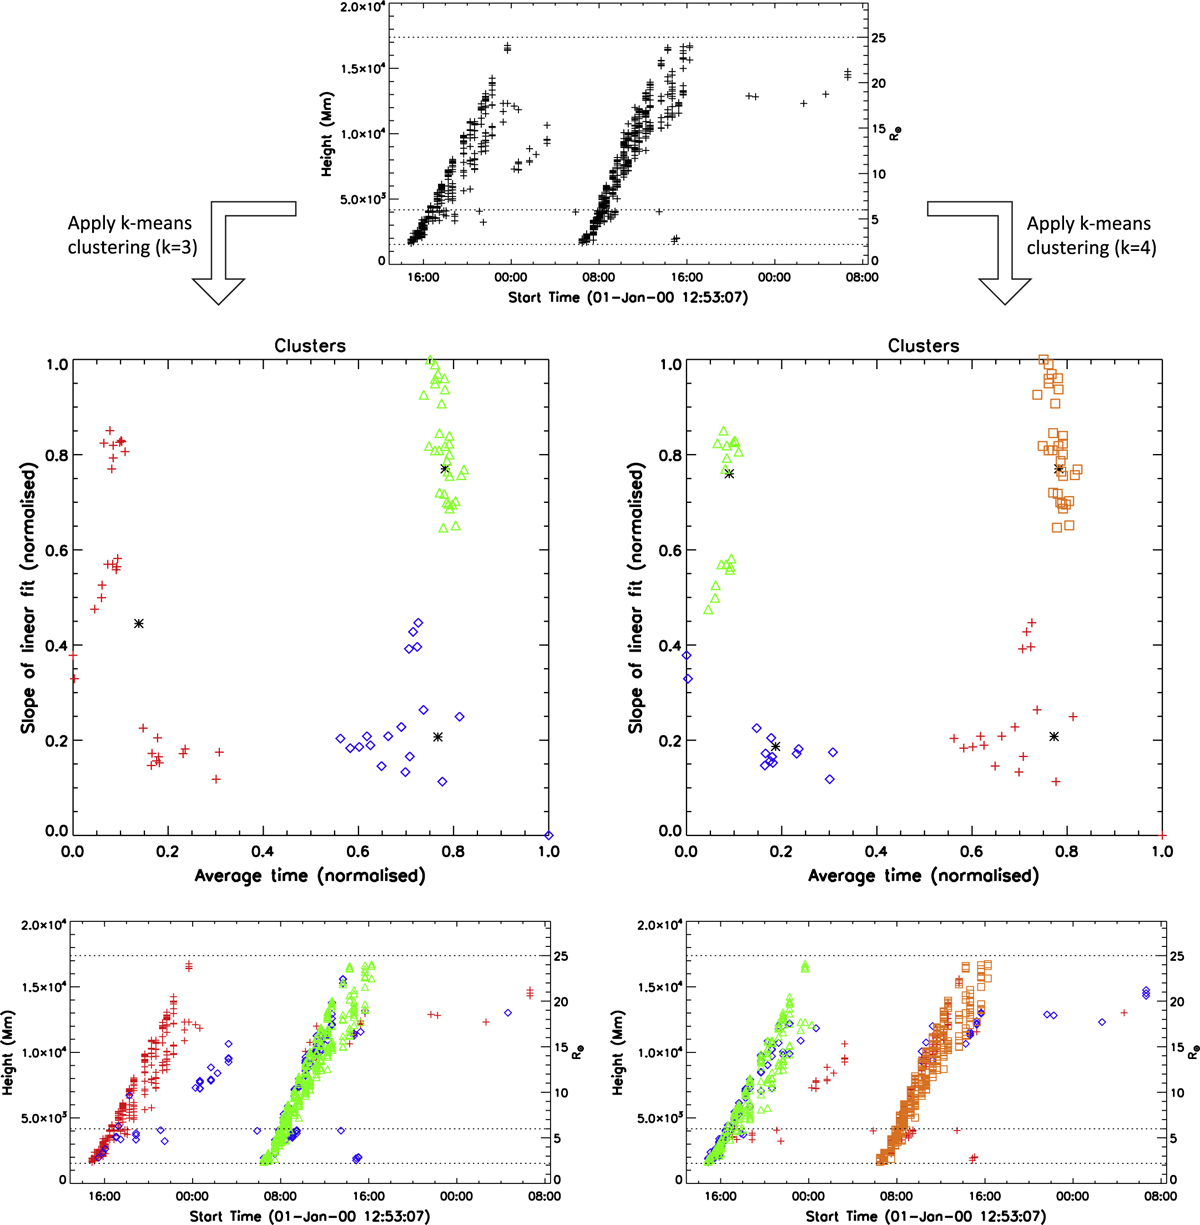
Fig. 10.
Download original image
A k-means clustering algorithm applied to the height-time data on 2000 January 01–03 (from Fig. 4), in an effort to distinguish the multiple CME profiles that were detected as a single event due to their close proximity in space and time. Top plot: The height-time measurements of the CME detections from the automated CORIMP catalog. (Note, this dataset has been put through a cleaning algorithm, discussed in Sect. 2.1, that removes a lot of inner-core and trailing-material datapoints, thus making it easier to distinguish their separate profiles.) Middle plots: The resulting clusters for the cases of k = 3 (left) and k = 4 (right), applied to the normalised parameters of the slope of a linear fit to, and the mean time of, the height-time profile at each position angle. The clusters are distinguished by different plot symbols and colours, with black asterisks to indicate the mean of each cluster. Bottom plots: The resulting effort at separately distinguishing the CME height-time profiles.
Current usage metrics show cumulative count of Article Views (full-text article views including HTML views, PDF and ePub downloads, according to the available data) and Abstracts Views on Vision4Press platform.
Data correspond to usage on the plateform after 2015. The current usage metrics is available 48-96 hours after online publication and is updated daily on week days.
Initial download of the metrics may take a while.