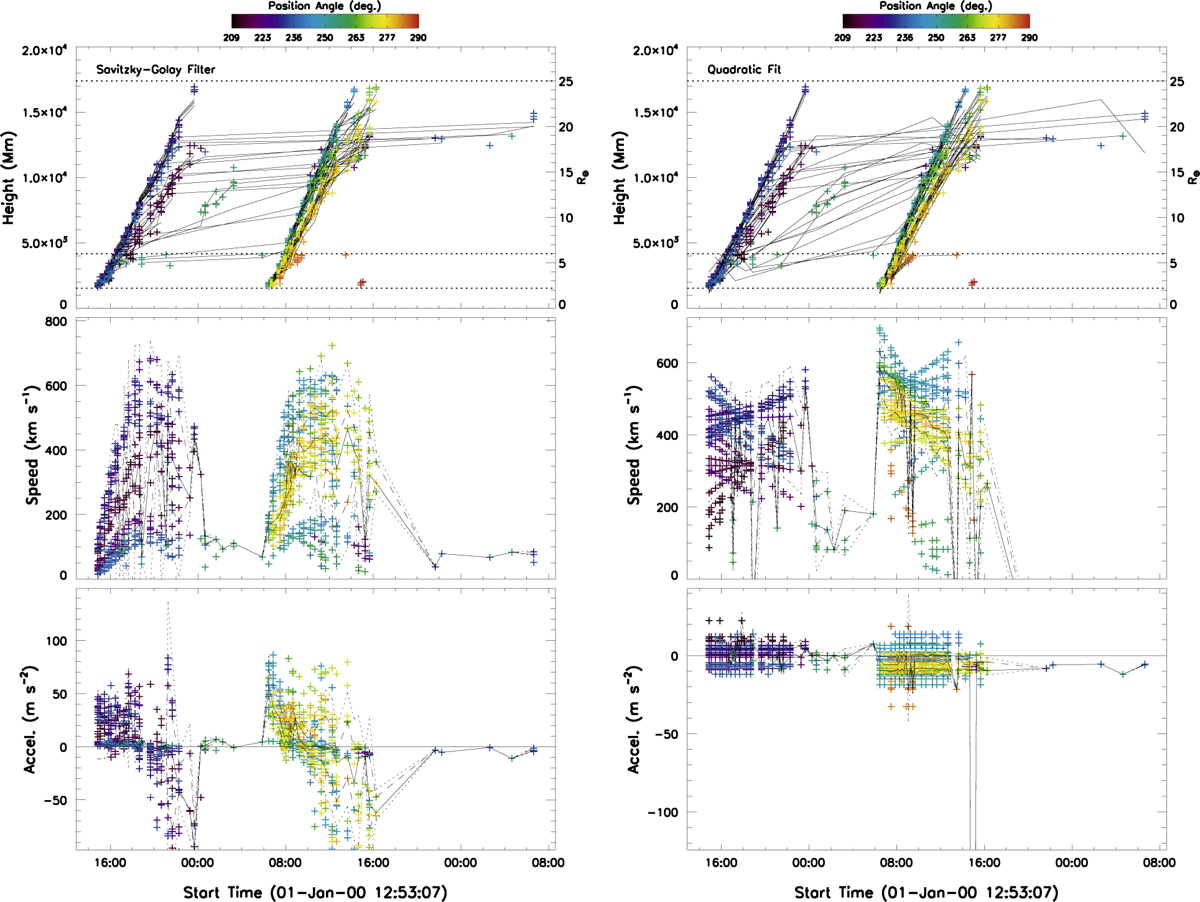
Fig. 4.
Download original image
Kinematic plots of the 2000 January 02 CME from the automatic detection and tracking in the CORIMP catalog. The top plots show the height-time measurements with a colorbar to indicate the angular span of the datapoints, and solid black lines to indicate the fitting. The middle and bottom plots show the speed and acceleration profiles of the CME with the median (solid line), interquartile range (inner dashed lines) and upper and lower fences (outer dashed lines) over-plotted. The left plots are determined by a Savitzky-Golay filter applied to the height-time measurements with a 7-point moving window, while the right plots are determined with a second-order quadratic fit.
Current usage metrics show cumulative count of Article Views (full-text article views including HTML views, PDF and ePub downloads, according to the available data) and Abstracts Views on Vision4Press platform.
Data correspond to usage on the plateform after 2015. The current usage metrics is available 48-96 hours after online publication and is updated daily on week days.
Initial download of the metrics may take a while.