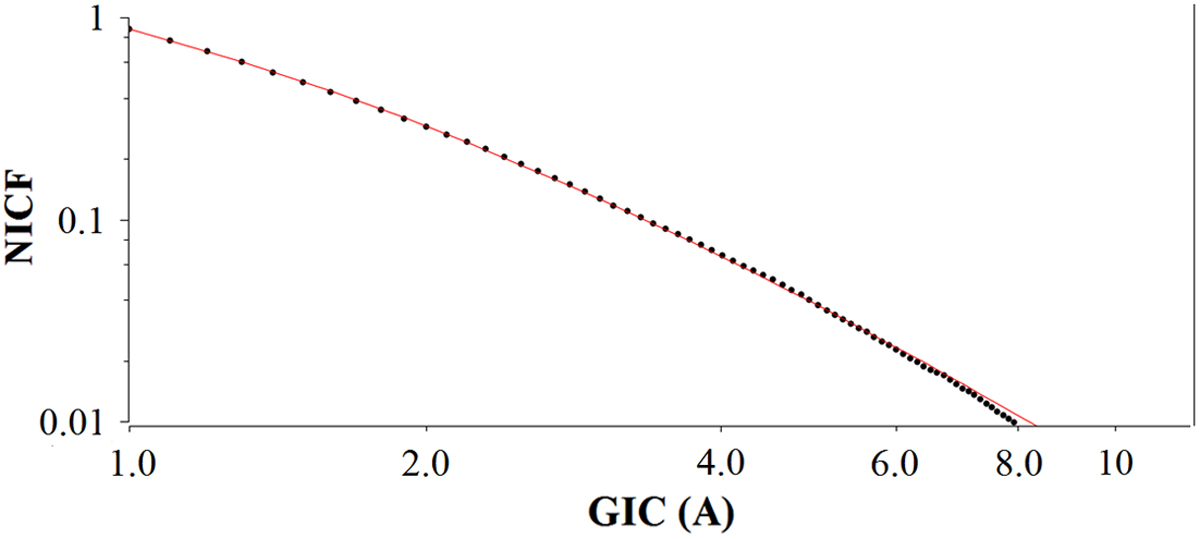
Fig. 5.
Download original image
Normalized inverse cumulative frequency (NICF) distribution of calculated GIC in the neutral of the Itumbiara 500 kV transformer for strong geomagnetic storms during the solar cycle 23. The black dots show the data. The red curve represents the q-exponential Tsallis distribution fit given by Eq. (8) with q = 1.25, B = 1.77 A−1 and C = 1.18.
Current usage metrics show cumulative count of Article Views (full-text article views including HTML views, PDF and ePub downloads, according to the available data) and Abstracts Views on Vision4Press platform.
Data correspond to usage on the plateform after 2015. The current usage metrics is available 48-96 hours after online publication and is updated daily on week days.
Initial download of the metrics may take a while.