Fig. 11
Download original image
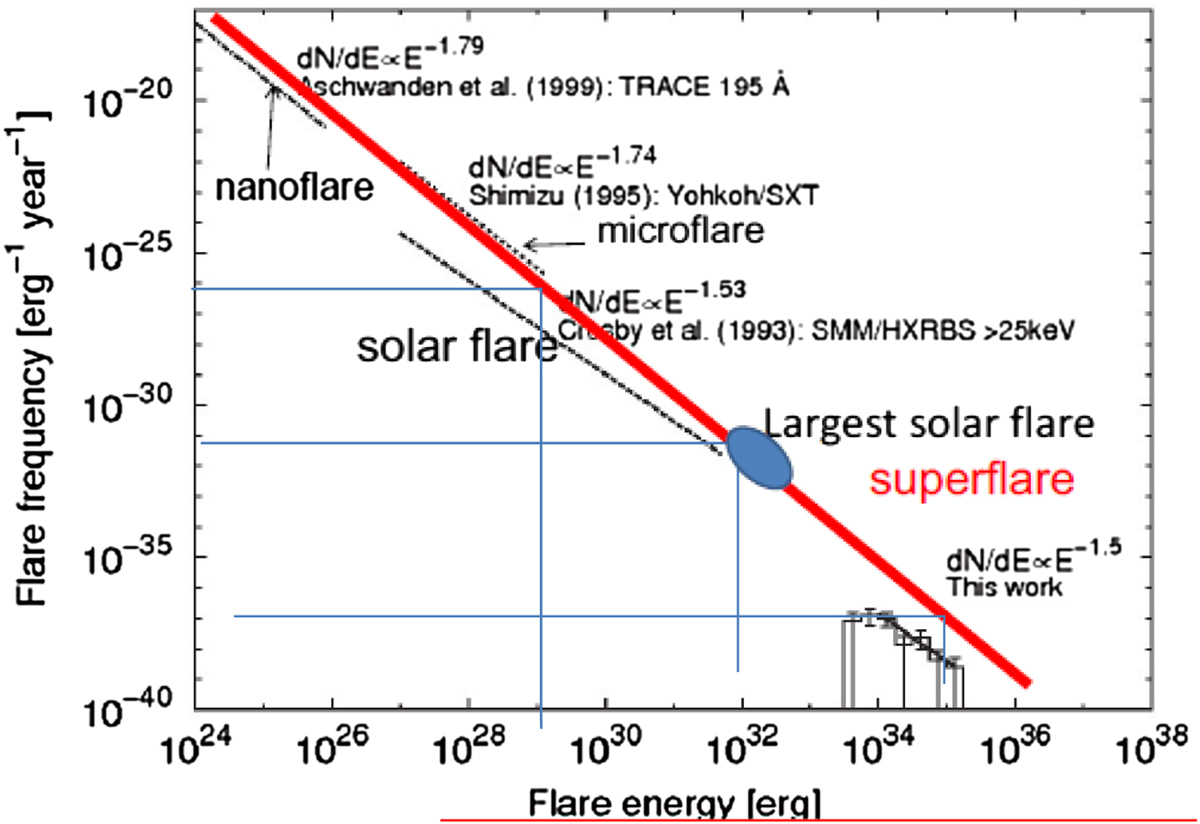
Comparison between the occurrence rate of superflares on G-type stars and those of solar flares (Shibata et al., 2013). The solid-line histogram shows the frequency distribution of superflares on Sun-like stars. The error bars in the histogram represent the square root of the event number in each bin. This distribution can be fitted by a power-law function with an index of ≈1.5 ± 0.3 (thick solid line). The dashed line, dotted line, and dot-dashed line indicate the power-law distribution of solar flares observed in EUV (Aschwanden et al., 2000), soft X-rays (Shimizu, 1995), and hard X-rays (Crosby et al., 1993), respectively. The red line corresponds to a power-law function with an index of 1.8 (from theoretical estimate by Aschwanden, 2012). Largest solar flare marked by blue oval.
Current usage metrics show cumulative count of Article Views (full-text article views including HTML views, PDF and ePub downloads, according to the available data) and Abstracts Views on Vision4Press platform.
Data correspond to usage on the plateform after 2015. The current usage metrics is available 48-96 hours after online publication and is updated daily on week days.
Initial download of the metrics may take a while.