Fig. 3
Download original image
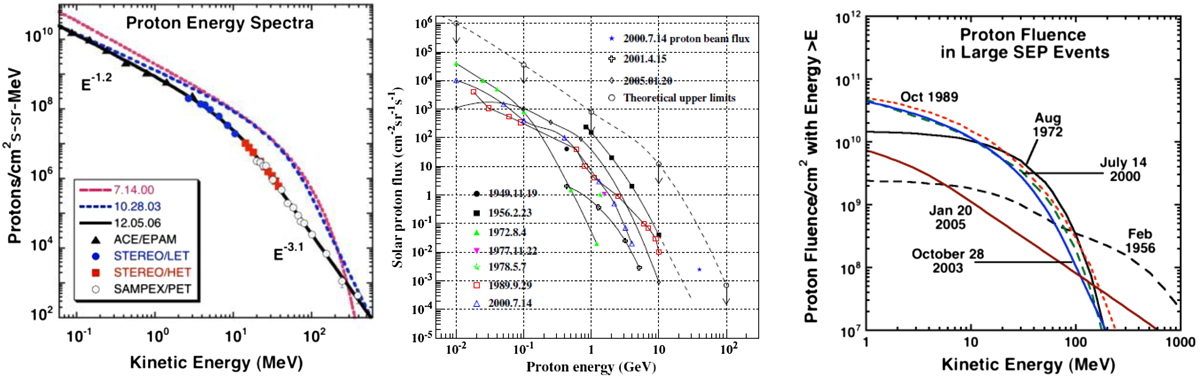
Left panel: Time-of-maximum differential spectra for several SPEs observed at the Earth’s orbit (14 July 2000, 28 October 2003, 12 May 2006) and at some distance from the Earth (5 December 2006) (adapted from Mewaldt et al., 2007). Middle panel: Integral intensity spectra for several GLEs in the energy range between 10 MeV–10 GeV (from Wang, 2009) along with expected upper limit spectrum (ULS) by Miroshnichenko (1996) (dashed curve). Right panel: Spectra of proton fluences obtained for several large SPEs of 1956–2005 (adapted from Mewaldt et al., 2005a,b, 2007).
Current usage metrics show cumulative count of Article Views (full-text article views including HTML views, PDF and ePub downloads, according to the available data) and Abstracts Views on Vision4Press platform.
Data correspond to usage on the plateform after 2015. The current usage metrics is available 48-96 hours after online publication and is updated daily on week days.
Initial download of the metrics may take a while.