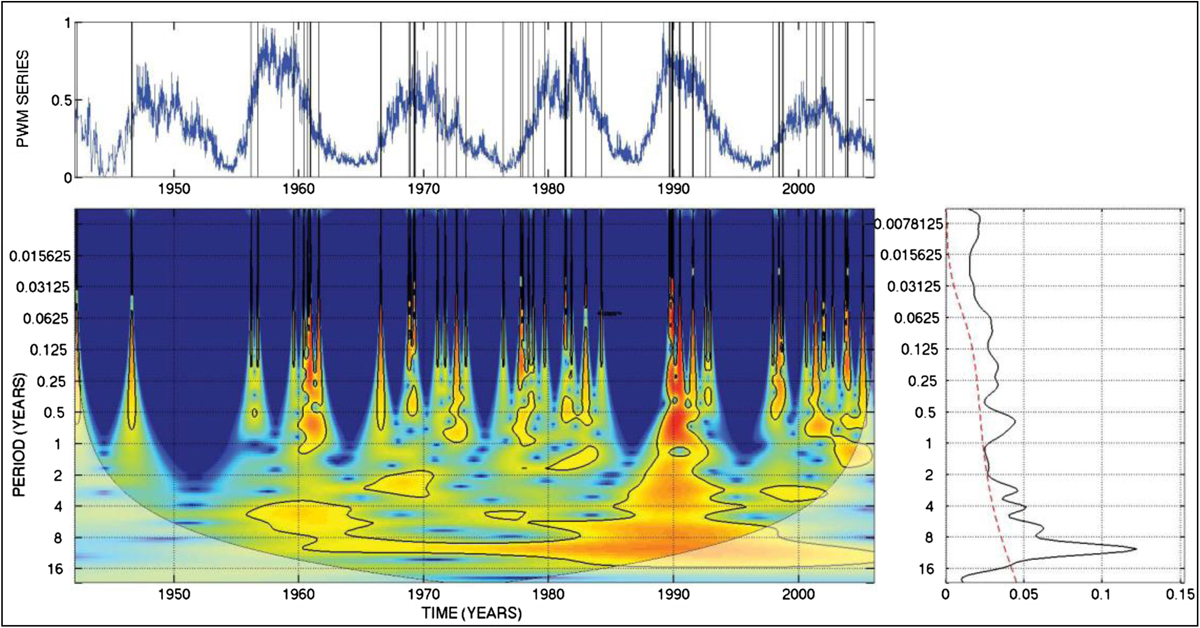
Fig. 4
Download original image
Occurrence (registration) rate oscillations for GLE events (Pérez-Peraza et al., 2009; Miroshnichenko et al., 2012). The PWM time series for the GLE occurrence rate constructed using the Morlet method by the registration dates of 70 events in 1942–2006 is given on the top panel. The blue curve at the top panel is the sunspot number. A wavelet diagram for the oscillation spectrum is shown on the bottom panel (the periods in year fractions are presented along the ordinate axis). The oscillation power density spectrum in arbitrary units (the abscissa axis) is shown on the right-hand side depending on the period as a fraction of the year (the ordinate axis). A dashed red line at the right panel corresponds to the red-noise level.
Current usage metrics show cumulative count of Article Views (full-text article views including HTML views, PDF and ePub downloads, according to the available data) and Abstracts Views on Vision4Press platform.
Data correspond to usage on the plateform after 2015. The current usage metrics is available 48-96 hours after online publication and is updated daily on week days.
Initial download of the metrics may take a while.